https://nexusfi.com/everything-else-programming/3477-vsa-volume-spread-analysis-thinkorswim.html
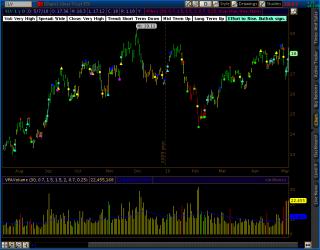
This study is for the paintings on the bar graph as seen in the screen shot.
Signals summary:
On top of Bar:
- Yellow Triangle
High volume Downbar after an upmove on high volume indicates weakness.
- Blue Circle
Reversal possible, yesterday was high volume wide spread up bar, but today we reached 10 days high with low close wide spread down bar.
- Red Triangle
UpThrust confirmation.
- Blue Triangle
A Down Bar closing down after a Pseudo Upthrust confirms weakness.
- Blue Square
Psuedo UpThrust, A Sign of Weakness /OR/ A High Volume Up Bar closing down in a uptrend shows Distribution /OR/ No Demand.
On bottom of bar:
- Aqua Triangle
High volume upbar closing on the high indicates strength (in short term down trend).
- Deep Pink Square
Test for supply.
- Green Square
Strength bar (either strength is showing in down trend or a supply test in up trend).
- Green Circle
Stopping volume. Normally indicates end of bearishness is nearing /OR/ No supply.
- Yellow Triangle
An Upbar closing near High after a Test confirms strength.
- Green Triangle
The previous bar saw strength coming back, This upbar confirms strength.
On the median of the bar:
- Turquoise circle
Effort to Rise. Bullish sign.
- Yellow circle
Effort to Fall. Bearish sign.
Category ThinkOrSwim
|
|
|


