in KR_SMI, i try to improve the visulaization and signal of ToS's Stochastic Momentum Index
1. i didn't like that it uses double EMA, so i changed that into a single-time EMA.
2. K Period, d Period .. confusing.. in reality SMI tries to identify the recent movement compared to a longer-term price shift. so i changed that into Look_Back_Period and Length
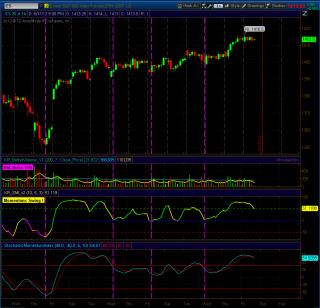
3. Signal is generated thru a crossing with a slower/smoothed EMA of SMI line. in reality, we can see the change of SMI line trend using colors and get an earlier signal for swings or price move shifting direction (Green = momentum up, red = momentum down, Yellow = possible swing detected)
4. crossing the zero line means a lot (momentum reversing). this is ignored in original indicator. so we added a zero line. Overbought/oversold are at +/-50% by default - but you can change that
screenshot shows how this compares vs the classic SMI in ToS
Best used together with a trend following indicator for a confirmed entry/exit signals.
just realized all the indicators i posted are optimized for dark chart background color. they will look ugly on light-color charts. sorry for that.
beware of a bug in ToS, when you use Inertia or Hull smoothing with AddChartLabel, and you try to enter a lower smoothing value in study settings, the indicator calc behaves erratically. if that happens, remove/re-add the study to your chart. i just found out about that and will report it.
as usual, please do not share outside BMT.
All feedback welcome,
RedK
Category The Elite Circle
|
|
|


