1. Added code to prevent 'out of valid range error' (picked up by Harry - thank you).
2. Changed condition for permission bar coloring.
3. Enabled option to show 1st Std Dev line.
4. Minor visual enhancements and tidied up the code.
For use in sideways or range bound markets.
You can save a few bob if you don't want to pay for a custom profile tool.
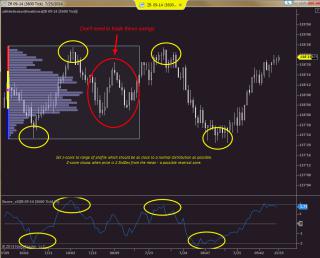
The z-score is used to compute the probability of occurrence of a value in a particular normally distributed range OR shows how many Standard deviations away from the mean is a value. If a value is 2 std dev from the mean and you have a nearly normal distribution then 95% of values within that distribution lie above/below your current value in other words there is a good probability that price will revert to the mean and this could be good place to look for a trade back to it or beyond it.
I have shown the volume profile for reference but you can see that this range is normally distributed.
The z-score indy is set to the range of your distribution in ticks. The yellow areas are turning points 2 std dev from the mean and offer the highest probability trades with the lowest risk but the red area turns out not to be worth trading and the z-score helps you stay away from the ambiguity this price action depicted in real time. (HL followed by a LH and then another HL).
v2.0 for NT7
v3.0 for NT7 (current)
Many have asked me for the custom Market Profile tool - you may find it here:
http://fin-alg.com/products/tpochart-rangeselect2.html
Good luck with your trading.
Category NinjaTrader 7 Indicators
|
|
|


