Only to be used with minute or daily charts.
The relative ranges indicator measures the range of a fixed period bar against the average range over the same period during the preceding n days. The version which can be downloaded here allows for two different comparisons:
All_Days: Today's ranges are compared to the average ranges of the N preceding business days. The default value is N = 40. With the setting "All_Days" the indicator requires the use of proper session templates which match the trading day of the instrument traded. Session templates that cut the week into arbitrary sessions - such as the session template 24/7 - cannot be handled by the indicator and will trigger an error message.
Day_Of_Week: Today's ranges are compared to the average ranges calculated for the same day of the week over the N preceeding weeks. The default value is N = 8. With the setting "Day_Of_Week", all session templates can be handled.
Holidays: Holidays as selected via the indicator dialogue box are excluded from all calculations.
Daylight savings schedules: The indicator automatically adjusts to different daylight savings zones.
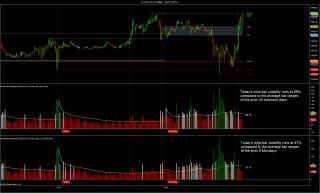
The histogram shows the relative ranges for the selected period of the day. For example on the chart today's highest relative range occured at 5:30 AM EST in the morning, just when the low of from Dec. 24 was taken out. Compared to the last 40 business days, the cumulated average of the relative ranges runs at 88%, whereas it runs at 87% when compared to a normal Monday. The low volatility is expected between Christmas and New Year's Eve.
Average range bars - between 80% and 120% of normal ranges - are shown as white bars. If the relative range exceeds 120% the histogram color is green, below 80% it is red. The colors can be selected by the user.
Category NinjaTrader 7 Indicators
|
|
|


