Only to be used with minute or daily charts.
The relative volume indicator measures the volume of a fixed period bar against the average volume over the same period during the preceding n days. The version which can be downloaded here allows for two different comparisons:
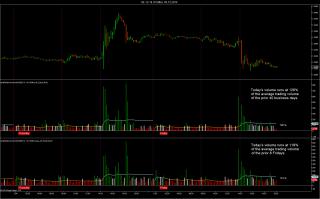
All_Days: Today's volume is compared to the average volume of the N preceding business days. The default value is N = 40. With the setting "All_Days" the indicator requires the use of proper session templates which match the trading day of the instrument traded. Session templates that cut the week into arbitrary sessions - such as the session template 24/7 - cannot be handled by the indicator and will trigger an error message.
Day_Of_Week: Today's volume is compared to the average volume calculated for the same day of the week over the N preceeding weeks. The default value is N = 8. With the setting "Day_Of_Week", all session templates can be handled.
Holidays: Holidays as selected via the indicator dialogue box are excluded from all calculations.
Daylight savings schedules: The indicator automatically adjusts to different daylight savings zones.
The histogram shows the relative volume for the period of the day. For example on the chart today's highest relative volume occured after a news release, just prior to the start of the regular session. Compared to the last 40 business days, the relative volume was 593% (about 6 times higher than for a normal business), whereas it was 509% (about 5 times higher than for a normal Friday). The cumulated volume for today is 26% higher compared to an average business day and 20% higher compared to an average Friday.
Average volume bars - between 80% and 120% of normal volume - are shown as white bars. If the relative volume exceeds 120% the histogram color is green, below 80% it is red. The colors can be selected by the user.
Update February 26, 2013: Following the rescheduling of the daily trading sessions by CME in November 2012, the indicator did not work correctly. I had published a new version in the thread on the Relative Volume Indicator, which is now available for download here.
Update October 28, 2013: Null check added when calling ChartControl. The indicator can now be used as input series for other indicators or strategies.
Update December 5, 2014: Indicator entirely recoded. Indicator is now considerably faster and should cope with different data feeds. Option added to compare today's volume to all prior business days. The prior version could only do comparisons for the same day of the week.
Update December 10; 2014: Error message added to inform user when the chart lookback period is insufficient.
Update December 29, 2014: Holiday calendar and error messages updated.
Category NinjaTrader 7 Indicators
|
|
|


