Welcome to NexusFi: the best trading community on the planet, with over 150,000 members Sign Up Now for Free
Genuine reviews from real traders, not fake reviews from stealth vendors
Quality education from leading professional traders
We are a friendly, helpful, and positive community
We do not tolerate rude behavior, trolling, or vendors advertising in posts
We are here to help, just let us know what you need
You'll need to register in order to view the content of the threads and start contributing to our community. It's free for basic access, or support us by becoming an Elite Member -- see if you qualify for a discount below.
-- Big Mike, Site Administrator
(If you already have an account, login at the top of the page)
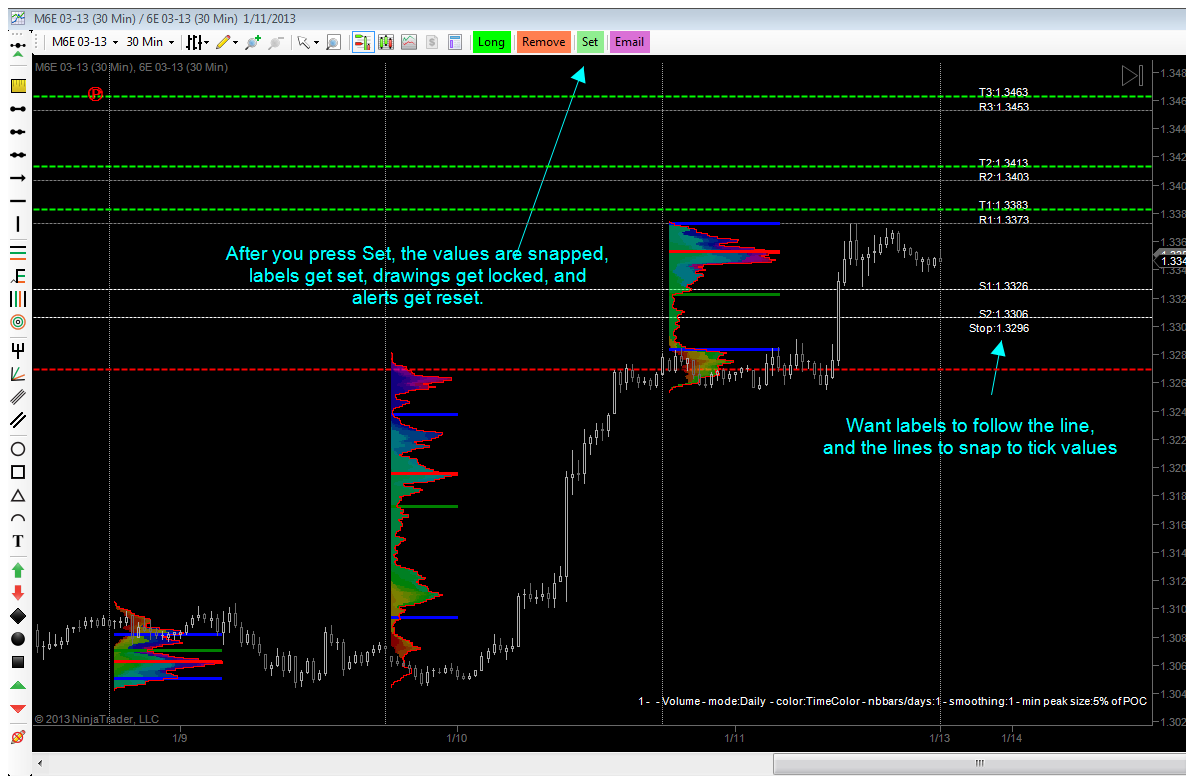
Got an alert system I'm working on that sends alerts from SR lines. The indicator draws lines that can then be adjusted by the user. My question is when I am in adjust mode, how do I make sure that the lines I am adjusting get rounded to the nearest tick like the chart trader lines?
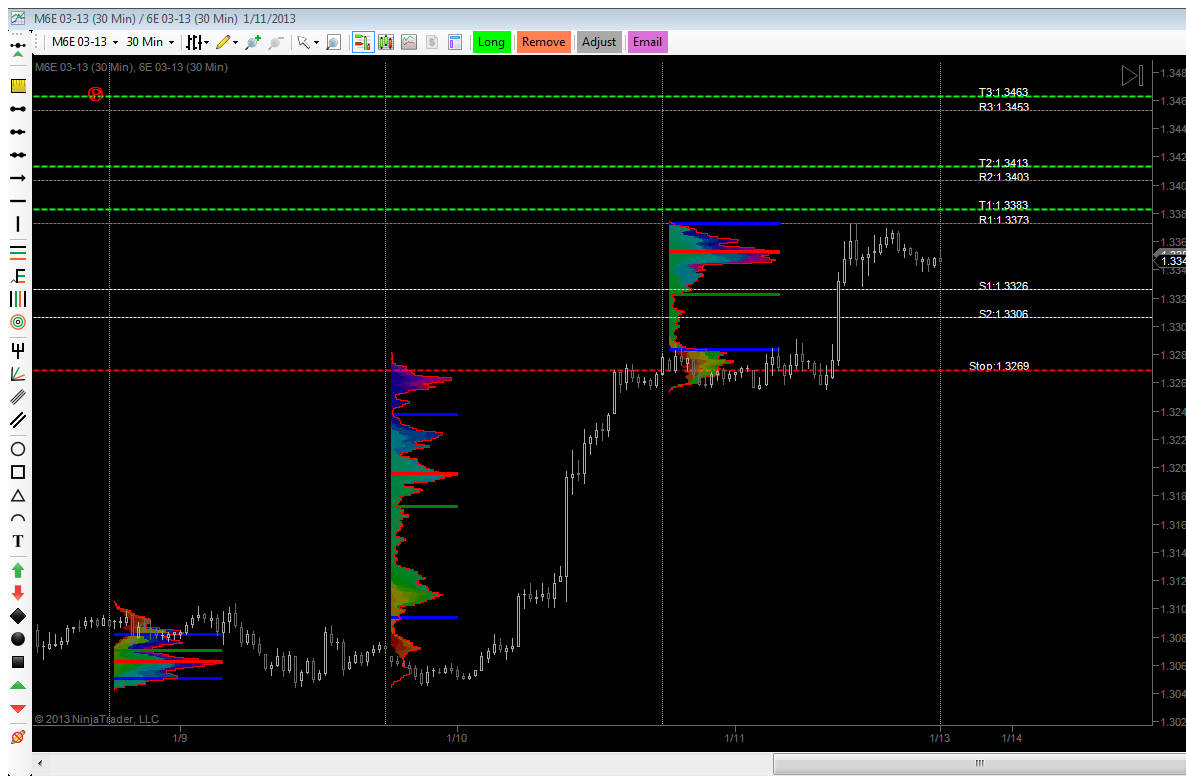
When the user clicks the draw/remove button, targets, stops, and SR lines are drawn or removed. When they get drawn, the indicator goes into adjust mode. While in adjust mode, all the levels are unlocked and can be moved by the user. When the user is moving these levels, I would like them to snap to rounded ticks like chart trader targets. Also, while the user is moving them, I would like the labels to be anchored to the lines so that they move with the lines in real time. Right now the values get snapped and the labels are moved once the user presses the set button.
Any ideas on how to do this? I was thinking to put it inside a timer, and round it 10x a second or something, but don't know if this would be the most efficient way to do it.
London Calling
Can you help answer these questions from other members on NexusFi?
Yes, I would tie it to mouse clicks too, only in adjust mode though, no need to run through it all the time.
Moving the labels real time is rather expensive, you would need to permanently get Y coordinate of the mouse while left button is down.
Flag or dynamic eventhandler when left mouse gets clicked in adjust mode, don't know which is cheaper. And then redraw the labels on mouse move (only if Y changes, no need to do it on X change, the checking will be cheaper than the redraw).
@vvhg could you post a snippet that would trigger an event every 100ms? I've never worked with timers, so don't know where to begin. Also do I use ChartControl.ActiveControl to figure out which object is selected? Since the lines are drawn internally, I know the tags. I don't want to adjust labels that don't need to be adjusted to keep it as "cheap" as possible lol. So I'm thinking to just return on the timer event if not in adjust mode. Then have a bool that is set to true on mouse down, false on mouse up. Return on the timer event if that bool is false. If it is in adjust mode, bool is true, and the active control is one of the drawn lines, then adjust the labels and rounded to the nearest tick. To save some cycles, I will just round and adjust the label. I will round the actual line y value to the nearest tick once the user locks("set") the levels.
Hmmm, I don't think a timer makes much sense, as you need the mouse move event either way (for the current Y value). Then starting and stopping the timer on mouse move would probably be more expensive than returning on the mouse move event. What you could better do is only subscribe to the event when needed, so in adjust mode.
You could have a look at the vvTrendLineTrader code for the mouse events, and at vvSuperGauge for converting mouse-Y to price if you need that. I can not provide any snippets now as I am away from the computer, so you would havet to wait until tomorrow.
@vvhg I will take a look at those two tools. I just need to make sure that on the mousemove event, one of the levels are actually being moved. Off the top of your head, do you know if one of those two tools checks if you are moving lines in the mouse events? I'm not in front of my computer either, so can't check now.
OK so I stole most of this code from @vvhg, and the rest I stole from NT support forum. This basic tool is just an example of what I was trying to do. What it does is check if a horizontal line is selected, and if it is it changes the color to red and adds a label. Just like the chart trader lines, once selected, you can move the line, and it will always round it to the nearest tick. The label follows the selected line. When a line is selected it is red, and returns to original color when you deselect it. Right now the label stays on the chart, and is not formatted, but I am tired and the point of this thread was to figure out how to do what I explained in the first post. Feel free to steal this code and make something useful out of it. I am working on an alert system that will use this, and once I finish the alert system, you will easily be able to create a strategy that uses the shell and be able to tie stops and targets to horizontal lines just like the chart trader Pretty much you will be able to run sophisticated ATM's and manage them just like the chart trader ATM's
It is great! But unfortunately it is not possible to change color of a line... It is the only disadvantage! Would it be possible to make available this change?
And I would also like to ask, how is it possible to add the label?


 Pretty much you will be able to run sophisticated