NexusFi: Find Your Edge


Home Menu


Disturbing Development In Euro Currency ETF - FXE


Discussion in Stocks and ETFs

Updated
    1. trending_up 3,139 views
    2. thumb_up 3 thanks given
    3. group 2 followers
    1. forum 2 posts
    2. attach_file 2 attachments


Search this Thread
  #1 (permalink)
 ab456 
New Delhi, India
 
Experience: Intermediate
Platform: SierraChart NinjaTrader,
Trading: ES,Stocks, Futures
Posts: 170 since Sep 2011
Thanks Given: 734
Thanks Received: 111

Disturbing Development In Euro Currency ETF - Seeking Alpha


Started this thread Reply With Quote

Can you help answer these questions
from other members on NexusFi?
The June 15 Resolution Trap: Irans Agreed Text Still Pri …
Prediction Markets & Event Contracts
Peace Deal Forward Curve: May 22%, June 51%, December 81 …
Prediction Markets & Event Contracts
Iran Forward Curve: June 30 at 56% vs June 15 at 28% -- …
Prediction Markets & Event Contracts
The 50/50 Paradox: Peace and Invasion Each at 20% -- Ira …
Prediction Markets & Event Contracts
I Have a Thing Called Iran -- Trump Stays in DC as Airsp …
Prediction Markets & Event Contracts
 
Best Threads (Most Thanked)
in the last 7 days on NexusFi
NexusFi site changelog and issues/problem reporting
8 thanks
Darmok and Jalad at Tanagra
1 thanks
  #3 (permalink)
 
Fat Tails's Avatar
 Fat Tails 
Berlin, Europe
Legendary Market Wizard
 
Experience: Advanced
Platform: NinjaTrader
Broker: Interactive Brokers
Trading: Futures & Stocks
Posts: 9,887 since Mar 2010
Thanks Given: 4,242
Thanks Received: 27,117


There has been a notable outflow of funds this year, as it is a long only currency fund. This will probably have a negative impact on returns.

Notable ETF Outflow Detected - FXE (ETFChannel.com, Contributor)

"Looking today at week-over-week shares outstanding changes among the universe of ETFs covered at ETF Channel, one standout is the Euro Trust (AMEX: FXE) where we have detected an approximate $24.7 million dollar outflow — that’s a 8.3% decrease week over week (from 2,400,000 to 2,200,000).

The chart below shows the one year price performance of FXE, versus its 200 day moving average:
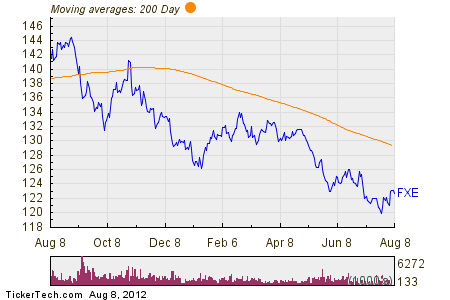


Looking at the chart above, FXE’s low point in its 52 week range is $119.73 per share, with $144.93 as the 52 week high point — that compares with a last trade of $122.73. Comparing the most recent share price to the 200 day moving average can also be a useful technical analysis technique — learn more about the 200 day moving average".


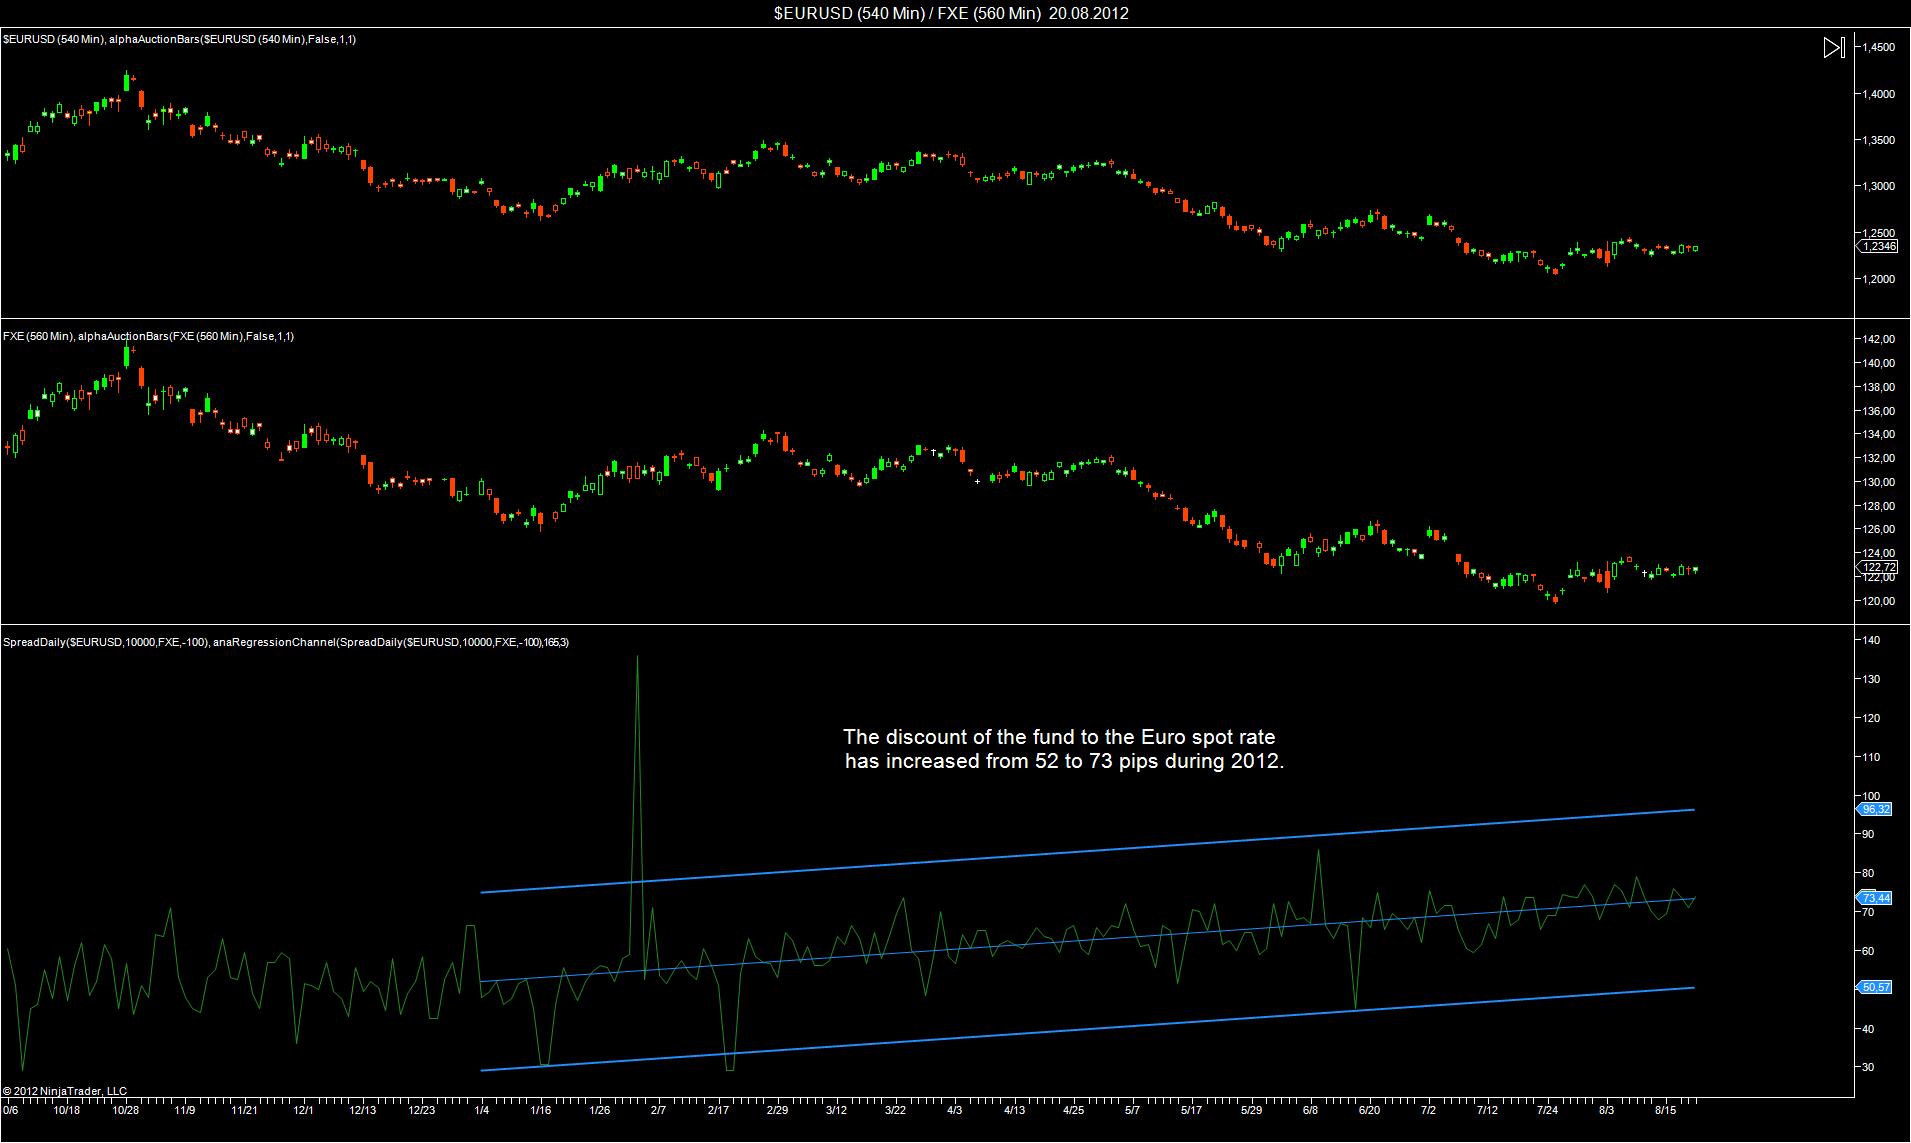
Also in an emergency case, it will probably not be easy to exit the fund as fast as the Euro. Therefore the discount to the Euro is growing. Not really a good investment. There is the risk that the fund will be dissolved, if it cannot attract enough investors. In that case arbitrage is not a good idea.

Reply With Quote
Thanked by:


Last Updated on August 20, 2012


© 2026 NexusFi®, s.a., All Rights Reserved.
Av Ricardo J. Alfaro, Century Tower, Panama City, Panama, Ph: +507 833-9432 (Panama and Intl), +1 888-312-3001 (USA and Canada)
All information is for educational use only and is not investment advice. There is a substantial risk of loss in trading commodity futures, stocks, options and foreign exchange products. Past performance is not indicative of future results.
About Us - Contact Us - Site Rules, Acceptable Use, and Terms and Conditions - Downloads - Top
no new posts



