NexusFi: Find Your Edge


Home Menu


Retracement/Sideways action follow peaks of volume?


Discussion in Traders Hideout

Updated
      Top Posters
    1. looks_one MWinfrey with 4 posts (8 thanks)
    2. looks_two jefe with 1 posts (0 thanks)
    3. looks_3 Quick Summary with 1 posts (0 thanks)
    4. looks_4 Xav1029 with 1 posts (0 thanks)
    1. trending_up 4,115 views
    2. thumb_up 8 thanks given
    3. group 5 followers
    1. forum 6 posts
    2. attach_file 2 attachments


Search this Thread
  #1 (permalink)
 
MWinfrey's Avatar
 MWinfrey 
Lubbock TX
 
Experience: Intermediate
Platform: NinjaTrader
Broker: Stage 5 Trading
Trading: CL
Posts: 1,878 since Jul 2009
Thanks Given: 1,450
Thanks Received: 3,336

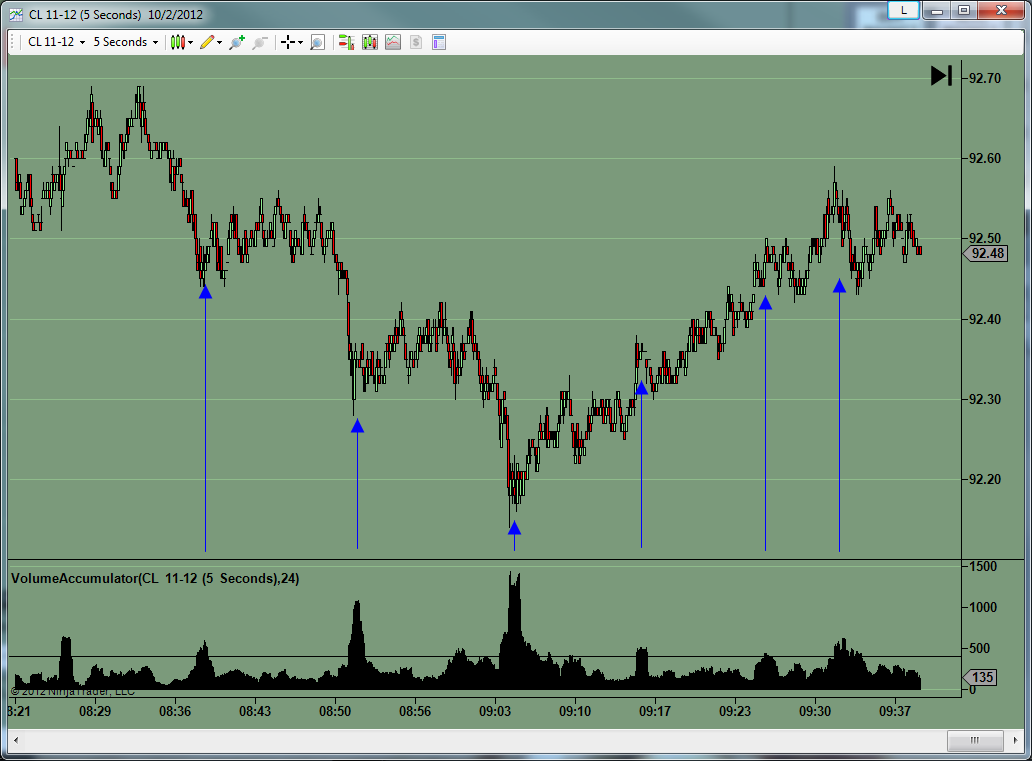
Been noticing peaks of volume are immediately followed by sideways or retracement action. Never saw this using the standard indicators but using one that I wrote that accumulates volume over a period is where I saw this behavior. Is this something worthy of study or am I just seeing things.


Started this thread Reply With Quote
Thanked by:

Can you help answer these questions
from other members on NexusFi?
CFTC Requests Tag 50 Trader Identity Data From CME and I …
Traders Hideout
CFTC Rewrites the Rulebook -- Kalshi Cracks $1B Non-Spor …
Prediction Markets & Event Contracts
Energy Futures Shatter All-Time Daily Volume: 8.3 Millio …
Commodities
More Than Capable: Hegseths War Warning Validates $114M …
Prediction Markets & Event Contracts
One Wallet Made $200K in Hours: AP Probes Polymarket Cea …
Prediction Markets & Event Contracts
 
Best Threads (Most Thanked)
in the last 7 days on NexusFi
Sober Journey With S&P
21 thanks
2026 Jlab journal
10 thanks
Algo automated / semi-automated trading anyone?
6 thanks
Lady Vols Primer: Trading Volatility Journal
6 thanks
Trying to learn Volume and price action correlation
5 thanks
  #3 (permalink)
 
Xav1029's Avatar
 Xav1029 
Tampa, FL
 
Experience: Beginner
Platform: NinjaTrader, Sierra Chart
Broker: Mirus Futures/Zen-Fire
Trading: 6E, M6E, 6J
Posts: 1,375 since Dec 2011
Thanks Given: 1,452
Thanks Received: 3,377


Are you using time based charts? If you are, I think you should track it and report back If using price based charts, it is kind of self explanatory.


Visit my NexusFi Trade Journal Reply With Quote
  #4 (permalink)
 
MWinfrey's Avatar
 MWinfrey 
Lubbock TX
 
Experience: Intermediate
Platform: NinjaTrader
Broker: Stage 5 Trading
Trading: CL
Posts: 1,878 since Jul 2009
Thanks Given: 1,450
Thanks Received: 3,336

I'll describe what I'm doing...I use a 5 second chart squeezed together with my Volume Accumulator indicator set to period of 24. The period of 24 essentially means the indicators sums the volume over the previous 24 bars with translates to the last minute. So, it's a rolling sum of volume over the last minute or whatever I set the period to.

I'm including my indicator and a template if anyone wants it.


Attached Files
Elite Membership required to download: VolumeAccumulator.zip
Elite Membership required to download: VolumeAccumulator.xml
Started this thread Reply With Quote
  #5 (permalink)
 
MWinfrey's Avatar
 MWinfrey 
Lubbock TX
 
Experience: Intermediate
Platform: NinjaTrader
Broker: Stage 5 Trading
Trading: CL
Posts: 1,878 since Jul 2009
Thanks Given: 1,450
Thanks Received: 3,336

oh by the way...the period parameter in that little indicator is immaterial. It's hard coded for 1 minute summations.


Started this thread Reply With Quote
  #6 (permalink)
 jefe 
Snoqualmie, WA
 
Experience: Advanced
Platform: NinjaTrader
Trading: TF, 6E and 6S
Posts: 26 since Jun 2010
Thanks Given: 8
Thanks Received: 9

Also, 60/5 is 12 not 24 anyway.


Reply With Quote
  #7 (permalink)
 
MWinfrey's Avatar
 MWinfrey 
Lubbock TX
 
Experience: Intermediate
Platform: NinjaTrader
Broker: Stage 5 Trading
Trading: CL
Posts: 1,878 since Jul 2009
Thanks Given: 1,450
Thanks Received: 3,336


jefe View Post
Also, 60/5 is 12 not 24 anyway.

Duh...of course.

I have excellent math skills as long I get the right answer.


Started this thread Reply With Quote


Last Updated on February 20, 2013


© 2026 NexusFi®, s.a., All Rights Reserved.
Av Ricardo J. Alfaro, Century Tower, Panama City, Panama, Ph: +507 833-9432 (Panama and Intl), +1 888-312-3001 (USA and Canada)
All information is for educational use only and is not investment advice. There is a substantial risk of loss in trading commodity futures, stocks, options and foreign exchange products. Past performance is not indicative of future results.
About Us - Contact Us - Site Rules, Acceptable Use, and Terms and Conditions - Downloads - Top
no new posts