Welcome to NexusFi: the best trading community on the planet, with over 200,000 members Sign Up Now for Free
Genuine reviews from real traders, not fake reviews from stealth vendors
Quality education from leading professional traders
We are a friendly, helpful, and positive community
We do not tolerate rude behavior, trolling, or vendors advertising in posts
We are here to help, just let us know what you need
You'll need to register in order to view the content of the threads and start contributing to our community. It's free for basic access, or support us by becoming an Elite Member -- discounts are available after registering.
-- Big Mike, Site Administrator
(If you already have an account, login at the top of the page)
I am trying to overlay some breadth (ie PREM or S&P TICK) onto some of my charts, but it is not working properly.
IQFeed supports 1 second resolution for breadth. I created a new chart using intraday 1 second resolution for my breadth, and that works fine.
Then I want to overlay that into a new panel on my existing charts, like a 100k volume chart.
When I use the Overlay study (tried regular overlay, and overlay non-sync) none of them work properly. The data does not match what is shown on the separate breadth chart. At first glance it looks like it worked, but upon closer examination you can see the data is not aligned properly at all. It's like it is counting by bar # (perhaps) instead of looking at the time code and plotting the value that way.
Can someone help me figure out what I am doing wrong? Does Overlay not work for non-time based charts?
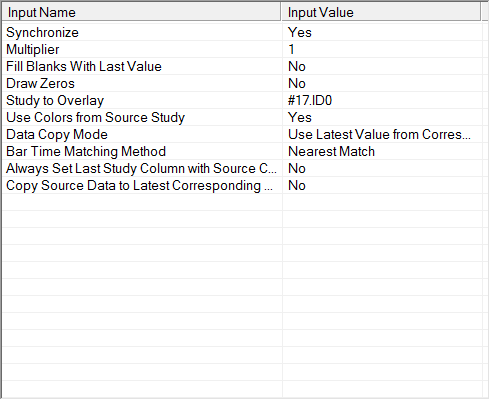
Try the Study/Price Overlay study. Sync set to No will give bars not tied to the destination chart's bars, set to Yes will have empty spaces between bars, unless Fill Blanks With Last Value is Yes.
Appears to have same problem as regular Overlay or regular Overlay non-sync, meaning that the data is not correct. The current data on last bar as it updates seems right, but historical bars are wrong data.
Do you have IQFeed? If so you can test easily, I am using:
- SP-PREM @ 1 second resolution, chart #17
- Chart #9 is 100k volume chart of @ES#C
Trying to overlay the PREM from #17 into panel #2 of chart #9. Once I get correct values, I will hide the overlay study and use a fast moving average on it and display that.
Just to make sure I am not wrong (as reading 1-second values for PREM can move a lot) I will try a simpler overlay later. I've used overlays many times in the past with success, but always on time based charts. This is the first time I've tried to do it on non-time based charts or charts that don't have the same underlying time frame.
OK maybe that one is actually working. I need to look more closely after close, too distracted right now.
The simple test I was using earlier was having two separate charts, say 100k vol and 25k vol, and before the Overlay panel looked identical between the two (impossible). Now it looks different, so maybe it is actually working.
I don't understand the difference between 'Overlay' and 'Study/Price Overlay'.
I switched to JT6T.Z (S&P TICK) and a smaller chart (2500 volume on ES) and it was much easier to read. I confirmed that the "Study/Price Overlay" is working.
Thanks so much!
The only remaining thing is I wish it were possible to see the current reading, so the last bar on the chart would show the most recent value (updating once per second to match chart #17). Right now I have to wait for the bar to close on the chart to see the value.