NexusFi: Find Your Edge


Home Menu


pulling price down on the Y axis


Discussion in Sierra Chart

Updated
    1. trending_up 1,977 views
    2. thumb_up 2 thanks given
    3. group 2 followers
    1. forum 2 posts
    2. attach_file 2 attachments


Search this Thread
  #1 (permalink)
 Itchymoku 
Philadelphia
 
Experience: None
Platform: corded black telephone
Trading: ticker tape
Posts: 2,892 since Apr 2012
Thanks Given: 1,683
Thanks Received: 3,681

hey, I've been making the switch from NT to Sierra Charts for their volume related indicators and I've been stuck on what seems like a really easy question that I simply cannot figure out. I want to pull price down on the chart without condensing price on the y axis. I found this possible on private banker's template but can't replicate it on my own custom made chart. If anyone could enlighten me I'd highly appreciate it. thanks


R.I.P. Joseph Bach (Itchymoku), 1987-2018.
Please visit this thread for more information.
Started this thread Reply With Quote

Can you help answer these questions
from other members on NexusFi?
Kharg Island at 6%, Regime Fall at 1.5% -- The Black Swa …
Prediction Markets & Event Contracts
Trump Truth Social Fires Hormuz From 10% to 59% -- Arsen …
Prediction Markets & Event Contracts
One Wallet Made $200K in Hours: AP Probes Polymarket Cea …
Prediction Markets & Event Contracts
Iran Lebanon Problem Kills Switzerland Talks, Brent at $ …
Prediction Markets & Event Contracts
CFTC Opens First COT Report Review in 20 Years -- Asks W …
Traders Hideout
 
Best Threads (Most Thanked)
in the last 7 days on NexusFi
Big Mike in Ecuador
205 thanks
Sober Journey With S&P
21 thanks
30 Sessions
20 thanks
Volume Indicators
8 thanks
Thanks Mike. Godspeed.
7 thanks
  #2 (permalink)
 Sawtooth 
Prescott AZ USA
 
Experience: Advanced
Platform: SierraChart
Broker: EdgeClear, FCM:Phillip, Data:Denali, Routing:Teton
Trading: YM RTY ES NQ
Posts: 480 since Nov 2009
Thanks Given: 222
Thanks Received: 608


Itchymoku View Post
hey, I've been making the switch from NT to Sierra Charts for their volume related indicators and I've been stuck on what seems like a really easy question that I simply cannot figure out. I want to pull price down on the chart without condensing price on the y axis. I found this possible on private banker's template but can't replicate it on my own custom made chart. If anyone could enlighten me I'd highly appreciate it. thanks

Left click and drag the y axis while holding the Ctrl key.

If you right click on the y axis and select Interactive Scale Move, you won't need the Ctrl key. Now if you use the Ctrl key, it will shrink/expand the y-axis.

You can also use the Hand tool.
Global Settings >> Tool Settings >> After Single Tool Use Change To: Hand
Also check Support Vertical Scaling/Movement With Hand Tool.

With Interactive Scale Move selected, you get the same movement whether using the y-axis or elsewhere on the chart.


Reply With Quote
Thanked by:
  #3 (permalink)
 
GaryD's Avatar
 GaryD 
Orlando, Florida
 
Experience: None
Platform: shoes
Trading: happy
Posts: 6,461 since May 2011


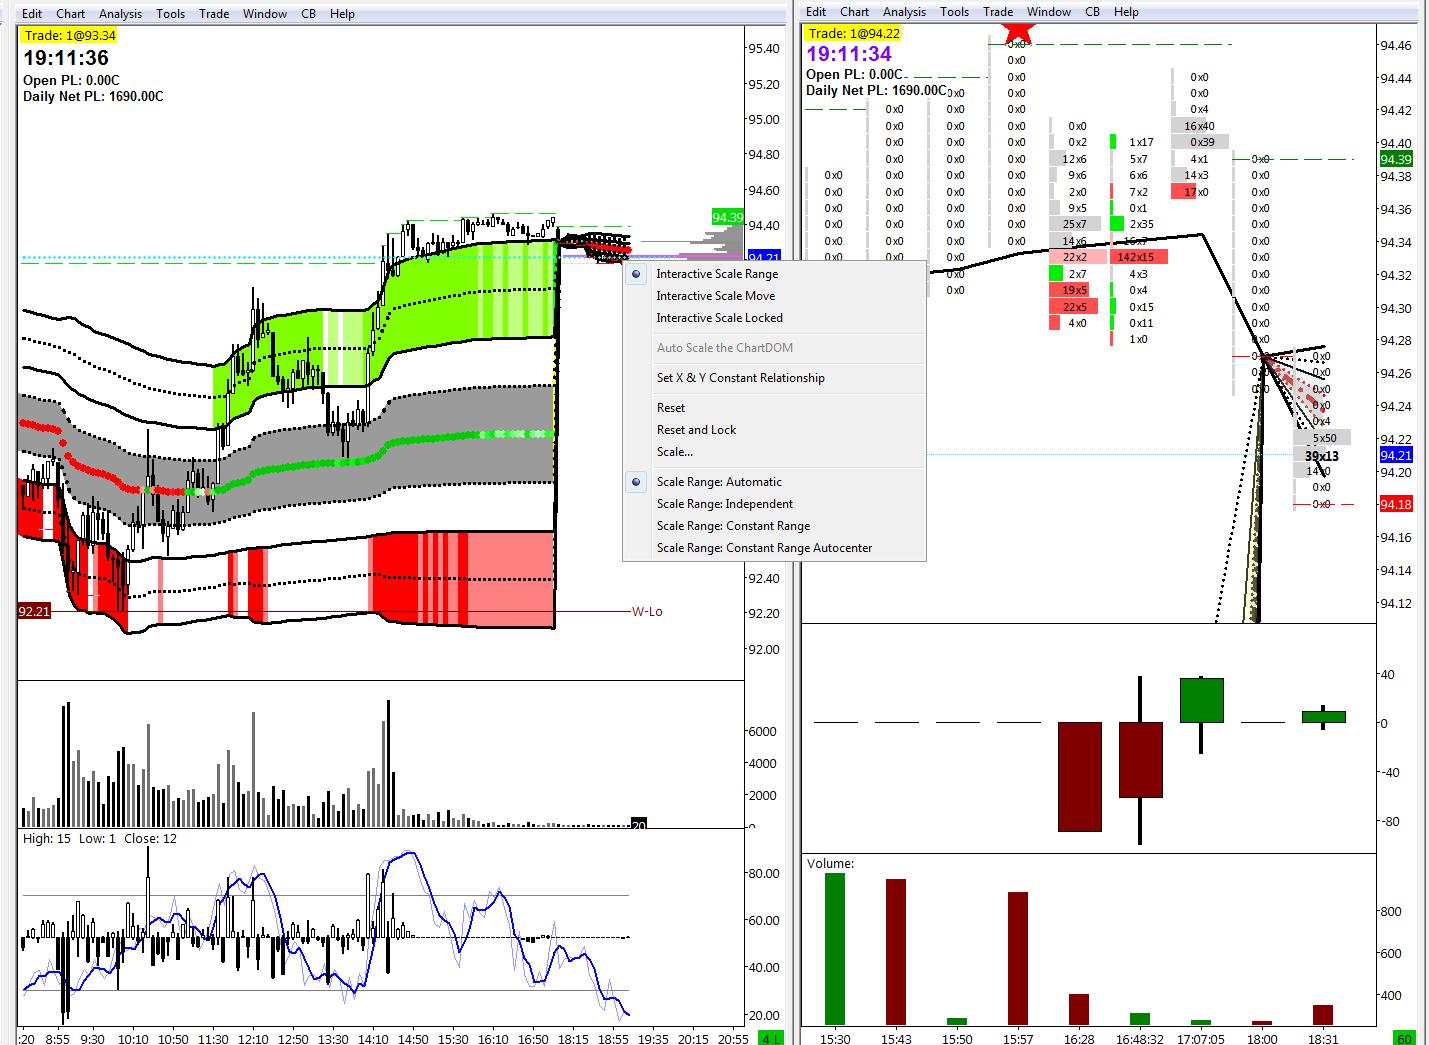
Right clicking on the price area will pull up the selctions. I use this feature a lot during the day, from Move, to Scale, to Reset. I am currently down to 2 screens, so I need to adjust things all day to see what I want.


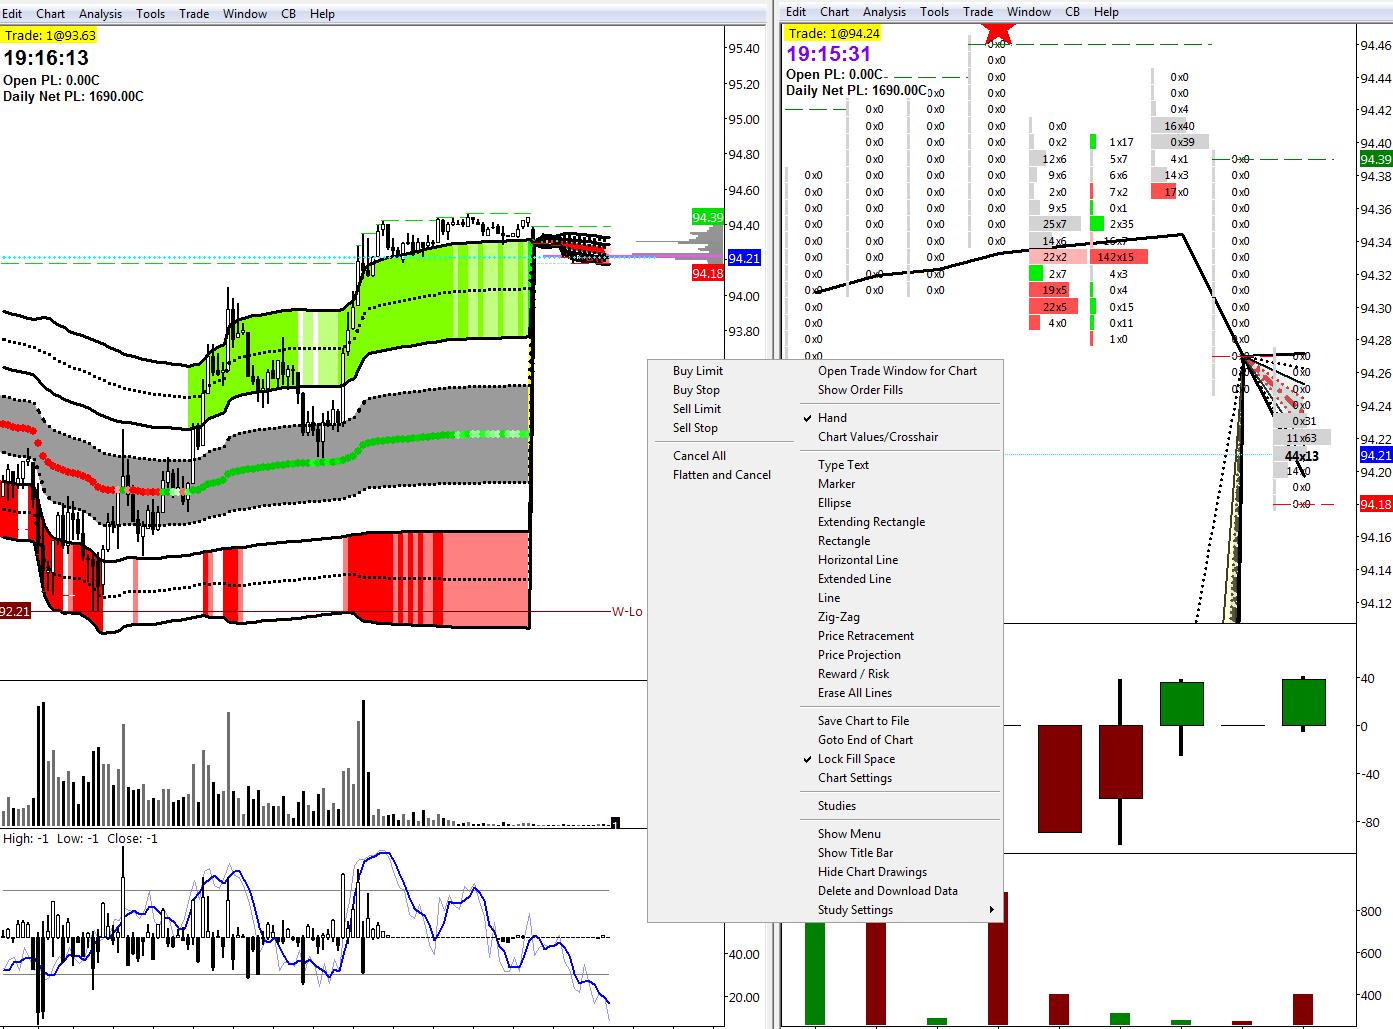
Another cool Sierra feature is the ability to put whatever menu items you want in the chart shortcut. Go to Global Settings/Customize Chart Shortcut Menu. I am nerly posiive yours looks different, since it is user selected, but this is what I have fast access to.


I have used Tradestation and Ninja Trader, and with Sierra I feel like I have a custom platform made for me. If you have other problems let me know.


Reply With Quote


Last Updated on May 23, 2013


© 2026 NexusFi®, s.a., All Rights Reserved.
Av Ricardo J. Alfaro, Century Tower, Panama City, Panama, Ph: +507 833-9432 (Panama and Intl), +1 888-312-3001 (USA and Canada)
All information is for educational use only and is not investment advice. There is a substantial risk of loss in trading commodity futures, stocks, options and foreign exchange products. Past performance is not indicative of future results.
About Us - Contact Us - Site Rules, Acceptable Use, and Terms and Conditions - Downloads - Top
no new posts