NexusFi: Find Your Edge


Home Menu


H/L FOR A SPECIFIC PERIOD OF TIME


Discussion in NinjaTrader

Updated
    1. trending_up 3,702 views
    2. thumb_up 8 thanks given
    3. group 2 followers
    1. forum 2 posts
    2. attach_file 1 attachments


Search this Thread
  #1 (permalink)
 FKtrader 
WA Europe
 
Experience: None
Platform: Various
Trading: FUTURES
Posts: 118 since Mar 2013
Thanks Given: 44
Thanks Received: 53

Hi,
I am looking for in tool for NT which can plot the High and the Low for a specific period of time.
Ex:I want to plot in my ETH YM chart the H/L during the time period from 05.00 EST to 08.00 EST.
Thanks in advance


Started this thread Reply With Quote

Can you help answer these questions
from other members on NexusFi?
Trump Lands in Beijing on CPI Day: Iran Peace Expires To …
Prediction Markets & Event Contracts
Expiration Day: Wall Street Rallies on Peace Hopes While …
Prediction Markets & Event Contracts
The Week Ahead -- CPI Wednesday With Oil Past $90, PPI L …
Traders Hideout
TradingView Opens Volume Footprint Data to Pine Script - …
TradingView
Penalties in Budapest, Peace Deadline in Tehran: Arsenal …
Prediction Markets & Event Contracts
 
Best Threads (Most Thanked)
in the last 7 days on NexusFi
Sober Journey With S&P
24 thanks
2026 Jlab journal
10 thanks
Lady Vols Primer: Trading Volatility Journal
7 thanks
Algo automated / semi-automated trading anyone?
6 thanks
Trying to learn Volume and price action correlation
5 thanks
  #3 (permalink)
 
Fat Tails's Avatar
 Fat Tails 
Berlin, Europe
Market Wizard
 
Experience: Advanced
Platform: NinjaTrader
Broker: Interactive Brokers
Trading: Futures & Stocks
Posts: 9,887 since Mar 2010
Thanks Given: 4,242
Thanks Received: 27,114


@adamribica: You can use the opening range V40 indicator which can be found here

https://nexusfi.com/download/ninjatrader-7/indicators/620-download.html?view

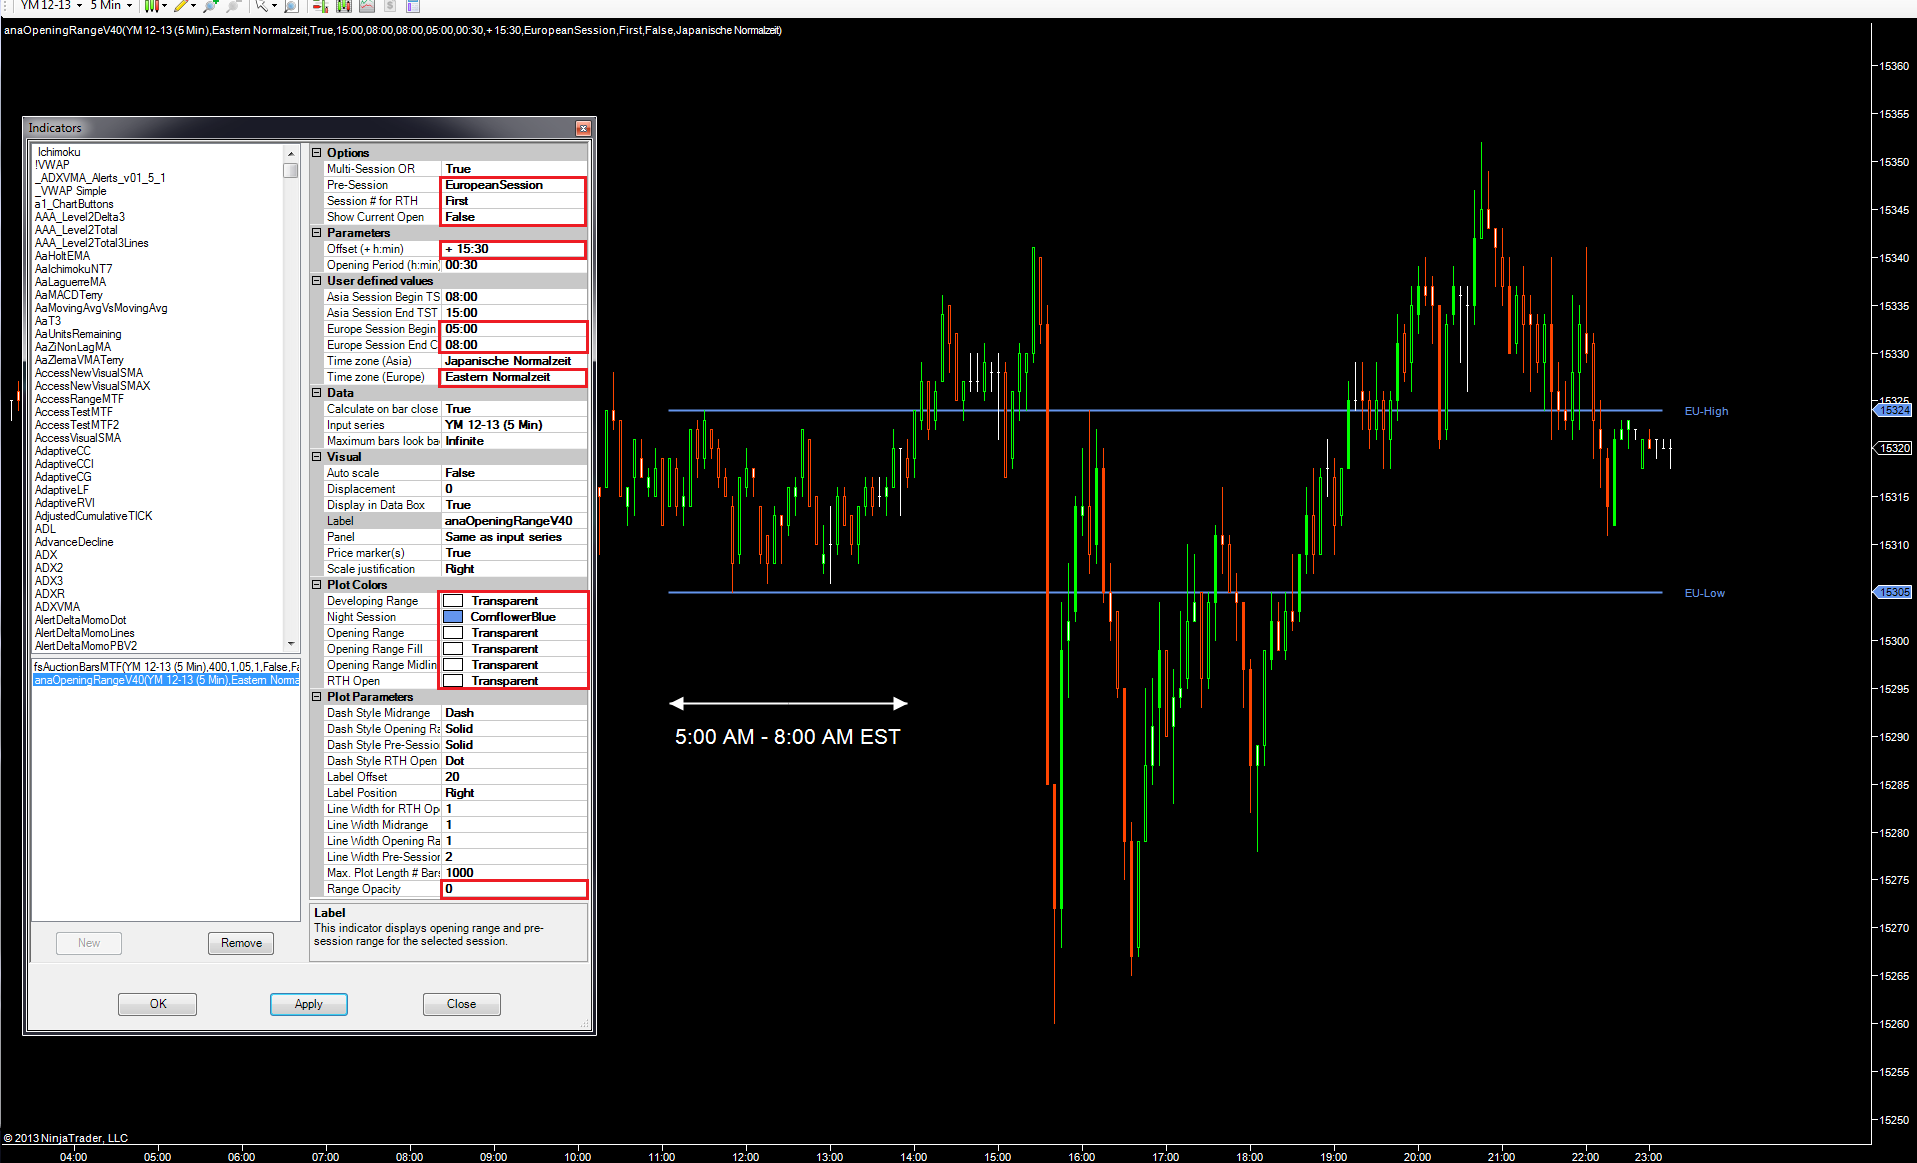
Following a suggestion by @gomi (thank you!), I have added a time zone drop down property to the indicator. This allows you to use the European session range shown by the indicator for your purposes.

Please select US Eastern Time for the European Session and set the session start time to 5:00 AM EST and the session end time to 8:00 AM EST.

The indicator will then display the high and low of that time period on your chart. The settings required are shown below. If you wish you can further change the labels to something different by modifying the code.


Reply With Quote


Last Updated on October 20, 2013


© 2026 NexusFi®, s.a., All Rights Reserved.
Av Ricardo J. Alfaro, Century Tower, Panama City, Panama, Ph: +507 833-9432 (Panama and Intl), +1 888-312-3001 (USA and Canada)
All information is for educational use only and is not investment advice. There is a substantial risk of loss in trading commodity futures, stocks, options and foreign exchange products. Past performance is not indicative of future results.
About Us - Contact Us - Site Rules, Acceptable Use, and Terms and Conditions - Downloads - Top
no new posts