NexusFi: Find Your Edge


Home Menu


Stop-run indicator?


Discussion in Platforms and Indicators

Updated
      Top Posters
    1. looks_one moneypenny with 4 posts (0 thanks)
    2. looks_two addchild with 3 posts (1 thanks)
    3. looks_3 wldman with 1 posts (0 thanks)
    4. looks_4 RickW00716 with 1 posts (0 thanks)
    1. trending_up 3,758 views
    2. thumb_up 1 thanks given
    3. group 5 followers
    1. forum 9 posts
    2. attach_file 0 attachments


Search this Thread
  #1 (permalink)
 moneypenny 
Albuquerque
 
Experience: Intermediate
Platform: NinjaTrader, Tradestation, Sierra Chart
Trading: Futures
Posts: 40 since Sep 2013
Thanks Given: 15
Thanks Received: 9

OK, so it seems to me that the best moves on an intraday time frame are preceded by stop runs. Most indicators give the opposite signals (do not go long or go short) say when price dips below a previous swing in an uptrend then turns positive. Anyone know if there's an indicator that spots this?
Thanks in advanced,
moneypenny


Started this thread Reply With Quote

Can you help answer these questions
from other members on NexusFi?
April FOMC Minutes: Most Divided Fed Since 1992 -- Many …
Traders Hideout
Victory Day Delivers: Russia-Ukraine Ceasefire Market Cl …
Prediction Markets & Event Contracts
Penalties in Budapest, Peace Deadline in Tehran: Arsenal …
Prediction Markets & Event Contracts
Khamenei Vetoes Uranium Transfer as Peace Odds Surge to …
Prediction Markets & Event Contracts
April Jobs Beat Flips Fed Hike Odds Past 52% for First T …
Traders Hideout
 
Best Threads (Most Thanked)
in the last 7 days on NexusFi
NexusFi site changelog and issues/problem reporting
8 thanks
Darmok and Jalad at Tanagra
1 thanks
  #3 (permalink)
 
wldman's Avatar
 wldman 
Chicago Illinois USA
Legendary Market Wizard
 
Experience: Advanced
Broker: IB, ToS
Trading: /ES, US Equities/Options
Frequency: Several times daily
Duration: Hours
Posts: 3,585 since Aug 2011
Thanks Given: 2,095
Thanks Received: 9,704


but that is an interesting question.


Visit my NexusFi Trade Journal Reply With Quote
  #4 (permalink)
 addchild 
Bay Area California
 
Experience: None
Platform: TT T4
Broker: Phillip Capital
Trading: Futures
Posts: 809 since Nov 2011
Thanks Given: 927
Thanks Received: 896

I played around with that idea a few years ago.

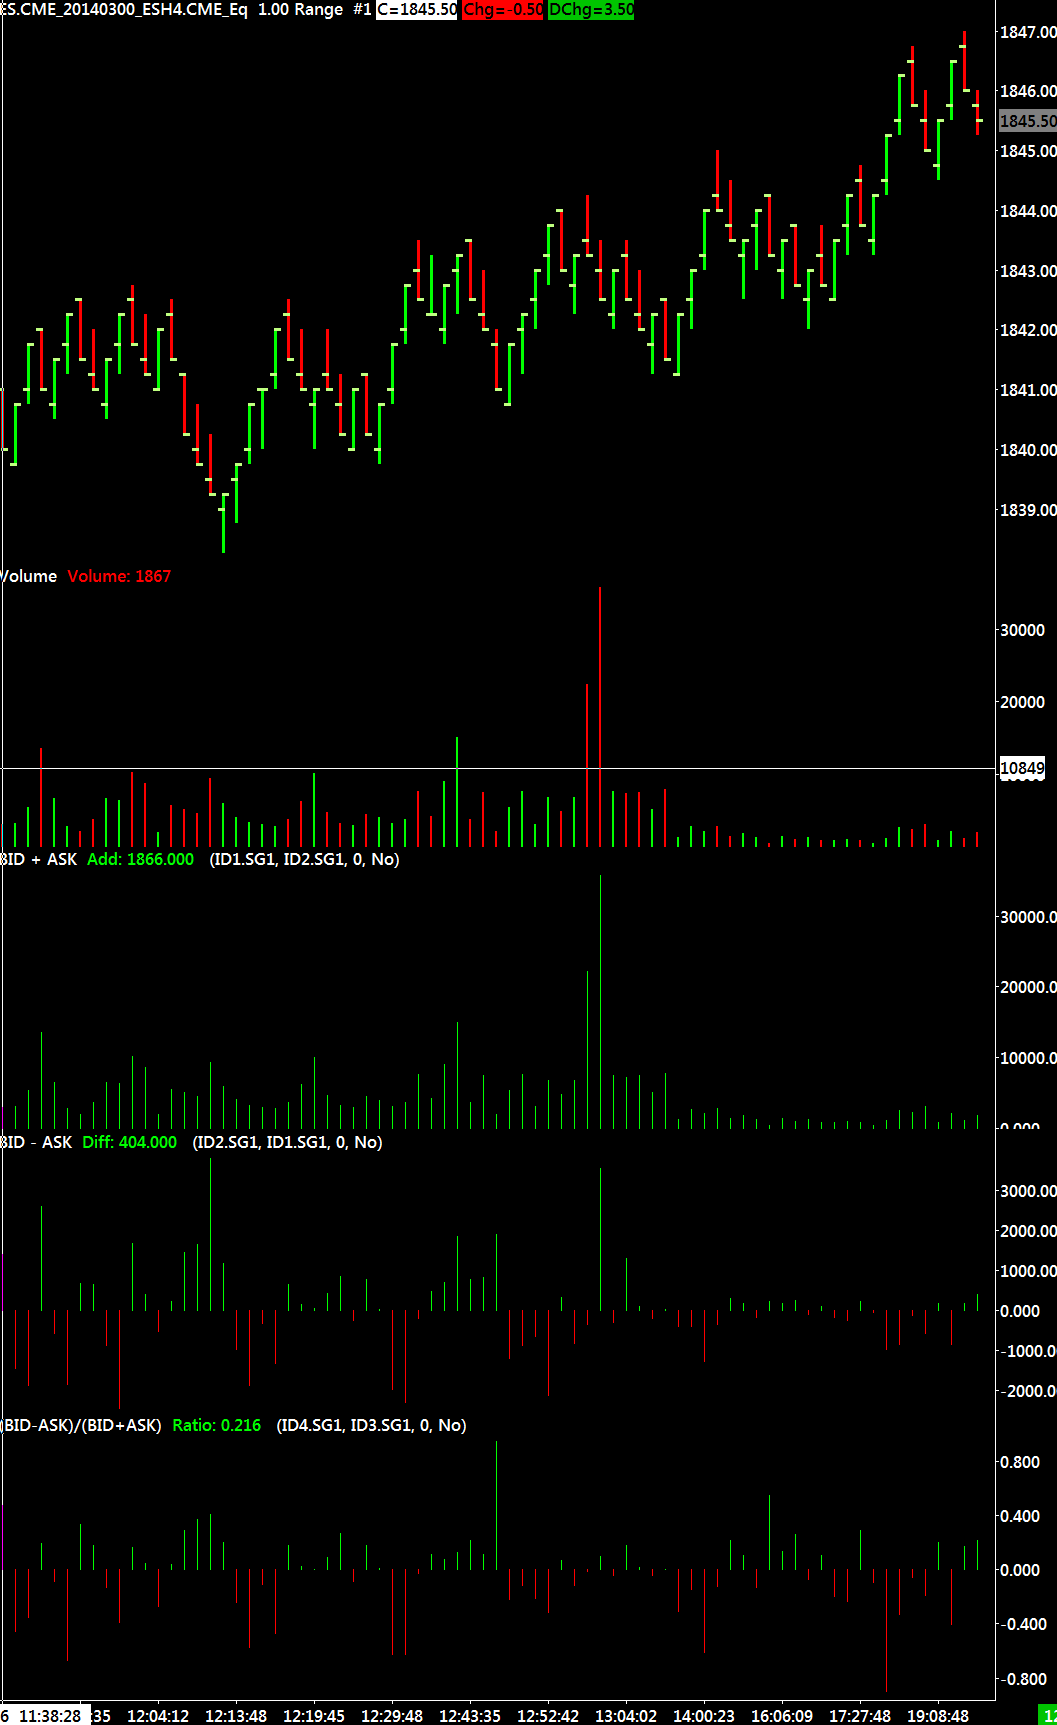
If you use a fixed range chart, and calculate (bid volume - ask volume)/total volume. The closer to 1 or -1 it reads the more one sided the move was, which is what happens when stops get hit.


.
Reply With Quote
  #5 (permalink)
 moneypenny 
Albuquerque
 
Experience: Intermediate
Platform: NinjaTrader, Tradestation, Sierra Chart
Trading: Futures
Posts: 40 since Sep 2013
Thanks Given: 15
Thanks Received: 9

Thanks for the replies addchild and wildman. Since I'm not a programmer, I'll have to see what I can 'scrounge' up addchild. Thanks s much for the idea!!
moneypenny


Started this thread Reply With Quote
  #6 (permalink)
 moneypenny 
Albuquerque
 
Experience: Intermediate
Platform: NinjaTrader, Tradestation, Sierra Chart
Trading: Futures
Posts: 40 since Sep 2013
Thanks Given: 15
Thanks Received: 9

addchild - I have a volume delta histogram from Ninjacators which gives the delta for actual transactions rather than bids/asks. Do you think that would work?
moneypenny


Started this thread Reply With Quote
  #7 (permalink)
 addchild 
Bay Area California
 
Experience: None
Platform: TT T4
Broker: Phillip Capital
Trading: Futures
Posts: 809 since Nov 2011
Thanks Given: 927
Thanks Received: 896


moneypenny View Post
addchild - I have a volume delta histogram from Ninjacators which gives the delta for actual transactions rather than bids/asks. Do you think that would work?
moneypenny

As long as the sum of all the transactions are equal to the total volume.

Sent from my toilet.


.
Reply With Quote
  #8 (permalink)
 moneypenny 
Albuquerque
 
Experience: Intermediate
Platform: NinjaTrader, Tradestation, Sierra Chart
Trading: Futures
Posts: 40 since Sep 2013
Thanks Given: 15
Thanks Received: 9


I don't think it is the right indicator... I'll keep looking.


Started this thread Reply With Quote
  #9 (permalink)
 RickW00716 
Richmond Virginia
 
Experience: Intermediate
Platform: Ninja Trader
Trading: ES
Posts: 318 since Feb 2013
Thanks Given: 306
Thanks Received: 163


moneypenny View Post

I don't think it is the right indicator... I'll keep looking.

GOM volume ladder gives bid and ask volumes...the difference between the 2 is in a red or green box at the bottom of the chart.

However I could find no instances where the formula generated a 1 or -1. (but i haven't looked that long either)


Reply With Quote
  #10 (permalink)
 addchild 
Bay Area California
 
Experience: None
Platform: TT T4
Broker: Phillip Capital
Trading: Futures
Posts: 809 since Nov 2011
Thanks Given: 927
Thanks Received: 896


moneypenny View Post

I don't think it is the right indicator... I'll keep looking.

it should look something like this
subgraph 1 = volume
subgraph 2 = bid volume + ask volume (this should be the same as volume)
subgraph 3 = bid volume - ask volume

and finally what I was referring to,
subgraph 4 = (bid volume - ask volume) / (bid volume + ask volume)


.
Reply With Quote
Thanked by:


Last Updated on February 27, 2014


© 2026 NexusFi®, s.a., All Rights Reserved.
Av Ricardo J. Alfaro, Century Tower, Panama City, Panama, Ph: +507 833-9432 (Panama and Intl), +1 888-312-3001 (USA and Canada)
All information is for educational use only and is not investment advice. There is a substantial risk of loss in trading commodity futures, stocks, options and foreign exchange products. Past performance is not indicative of future results.
About Us - Contact Us - Site Rules, Acceptable Use, and Terms and Conditions - Downloads - Top
no new posts