NexusFi: Find Your Edge


Home Menu


Plotting the difference of price/indicator or of any 2 indicators in Ninjatrader


Discussion in NinjaTrader

Updated
    1. trending_up 3,214 views
    2. thumb_up 1 thanks given
    3. group 2 followers
    1. forum 4 posts
    2. attach_file 3 attachments


Search this Thread
  #1 (permalink)
 
gisot's Avatar
 gisot 
Milan, Italy
 
Experience: Beginner
Platform: NinjaTrader, TWS
Trading: ES, Stocks
Frequency: Every few days
Duration: Minutes
Posts: 246 since Jan 2012
Thanks Given: 385
Thanks Received: 178

Has anyone created/used in ninjatrader an indicator calculating/plotting the difference between either price and any other indicator of interest, or any two indicators of interest? For ex plotting histogram of the difference between price and supertrend, or the difference between any moving avg and supertrend, or any other indicator of interest.
Thanks


Started this thread Reply With Quote

Can you help answer these questions
from other members on NexusFi?
Hormuz Completely Closed: US Strikes Day 2, Iran Shoots …
Traders Hideout
CME Launches Bitcoin Volatility Futures June 1 -- First …
Cryptocurrency
CME Group CEO Calls CFTC-Approved Crypto Perps Dangerous …
Traders Hideout
Penalties in Budapest, Peace Deadline in Tehran: Arsenal …
Prediction Markets & Event Contracts
Second Night of US Strikes Crushes Iran June 15 to 3.6% …
Prediction Markets & Event Contracts
 
Best Threads (Most Thanked)
in the last 7 days on NexusFi
NexusFi site changelog and issues/problem reporting
15 thanks
Darmok and Jalad at Tanagra
3 thanks
Big Mike in Ecuador
1 thanks
30 Sessions
1 thanks
  #2 (permalink)
 
DavidHP's Avatar
 DavidHP 
Isla Mujeres, MX
Legendary Market Wizard
 
Experience: Advanced
Platform: NinjaTrader
Broker: Ninjatrader / Optimus Futures / AmpFutures
Trading: NQ / ES / 6E / 6B / CL
Frequency: Every few days
Duration: Minutes
Posts: 1,817 since Aug 2009
Thanks Given: 11,767
Thanks Received: 3,043


Rejoice in the Thunderstorms of Life . . .
Knowing it's not about Clouds or Wind. . .
But Learning to Dance in the Rain ! ! !
Follow me on X Reply With Quote
  #3 (permalink)
 
gisot's Avatar
 gisot 
Milan, Italy
 
Experience: Beginner
Platform: NinjaTrader, TWS
Trading: ES, Stocks
Frequency: Every few days
Duration: Minutes
Posts: 246 since Jan 2012
Thanks Given: 385
Thanks Received: 178


guidoisot View Post
Has anyone created/used in ninjatrader an indicator calculating/plotting the difference between either price and any other indicator of interest, or any two indicators of interest? For ex plotting histogram of the difference between price and supertrend, or the difference between any moving avg and supertrend, or any other indicator of interest.
Thanks


@Fat Tails


Attached Thumbnails
Click image for larger version

Name:	PPO distance from ADX.PNG
Views:	360
Size:	75.9 KB
ID:	154110  
Started this thread Reply With Quote
  #4 (permalink)
 
Fat Tails's Avatar
 Fat Tails 
Berlin, Europe
Legendary Market Wizard
 
Experience: Advanced
Platform: NinjaTrader
Broker: Interactive Brokers
Trading: Futures & Stocks
Posts: 9,887 since Mar 2010
Thanks Given: 4,242
Thanks Received: 27,117


guidoisot View Post

A difference between the ADX and the PPO does not make sense to me, because the indicators do not use the same scale. However, the objective might be achieved with calculating a difference from the z-scores.


Reply With Quote
Thanked by:
  #5 (permalink)
 
gisot's Avatar
 gisot 
Milan, Italy
 
Experience: Beginner
Platform: NinjaTrader, TWS
Trading: ES, Stocks
Frequency: Every few days
Duration: Minutes
Posts: 246 since Jan 2012
Thanks Given: 385
Thanks Received: 178

@Fat Tails

When there is minimum of price f(x)
together with concomitant:
1) significant minimum of a measure of momentum, m(f(x)),
for ex. PPO (or MACD, or else? I do not know)
and
2) significant maximum of a measure of trend strength, t(f(x)),
for es. ADX (or other trend measuring function? I do not know)

the Price quite often, at different timeframes, goes in an uptrend

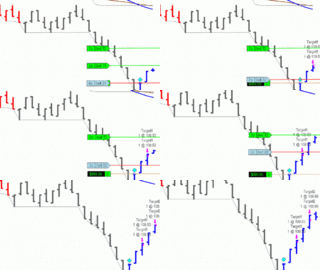
I did not consider the different scales of the two indicators, but I am using them combined only looking at the charts, which is time consuming. Anyway I was trying to find some help to convert this graphical analysis into a script for screening various instruments in various timeframes. I attach an image with a few examples.

Thank you.


Started this thread Reply With Quote


Last Updated on August 27, 2014


© 2026 NexusFi®, s.a., All Rights Reserved.
Av Ricardo J. Alfaro, Century Tower, Panama City, Panama, Ph: +507 833-9432 (Panama and Intl), +1 888-312-3001 (USA and Canada)
All information is for educational use only and is not investment advice. There is a substantial risk of loss in trading commodity futures, stocks, options and foreign exchange products. Past performance is not indicative of future results.
About Us - Contact Us - Site Rules, Acceptable Use, and Terms and Conditions - Downloads - Top
no new posts