Dark Theme
Light Theme
Welcome to NexusFi: the best trading community on the planet, with over 200,000 members Sign Up Now for Free
Genuine reviews from real traders, not fake reviews from stealth vendors
Quality education from leading professional traders
We are a friendly, helpful, and positive community
We do not tolerate rude behavior, trolling, or vendors advertising in posts
We are here to help, just let us know what you need
You'll need to
register in order to view the content of the threads and start contributing to our community.
It's free for basic access, or support us by becoming an Elite Member -- discounts are available after registering.
-- The NexusFi team
(If you already have an account, login at the top of the page)
Updated September 20, 2014
Top Posters
looks_one
josh
with 3 posts (6 thanks)
looks_two
arnie
with 2 posts (1 thanks)
looks_3
arroganzmaschine
with 2 posts (0 thanks)
looks_4
lemons
with 1 posts (0 thanks)
trending_up
4,769 views
thumb_up
8 thanks given
group
4 followers
forum
9 posts
attach_file
1 attachments
July 25th, 2013, 02:46 PM
Europe
Experience: Advanced
Platform: Jigsaw
Broker: Tradovate
Trading: Equities
Posts: 826 since May 2010
Thanks Given: 763
Thanks Received: 1,048
Is there a study that plots the midpoint for the day?
If I become half a percent smarter each year, I'll be a genius by the time I die
Can you help answer these questions
Best Threads (Most Thanked)
July 25th, 2013, 02:52 PM
Georgia, US
Experience: None
Platform: SC
Broker: Denali+Teton
Trading: ES, NQ, YM
Posts: 6,331 since Jan 2011
Thanks Given: 6,955
Thanks Received: 18,632
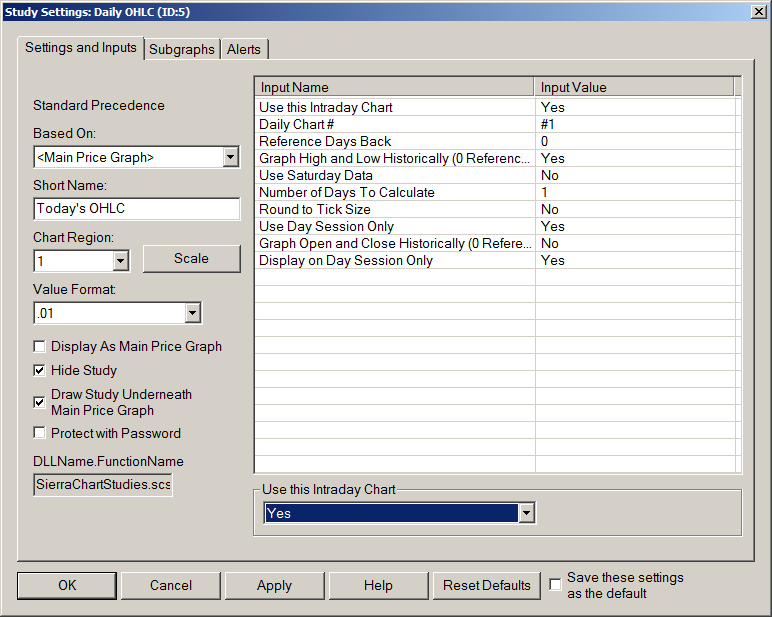
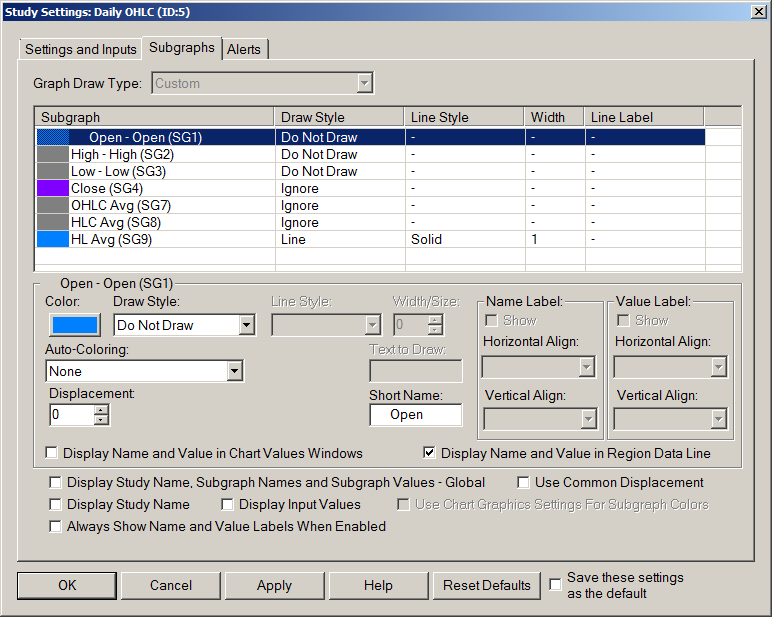
Use the Daily OHLC study with these settings:
July 25th, 2013, 03:34 PM
Europe
Experience: Advanced
Platform: Jigsaw
Broker: Tradovate
Trading: Equities
Posts: 826 since May 2010
Thanks Given: 763
Thanks Received: 1,048
josh
Use the Daily OHLC study with these settings:
You can show the OHL if you want too, or hide them as here, showing only the midpoint:
Round To Tick Size , shouldn't 1680.38 become 1680.50?
If I become half a percent smarter each year, I'll be a genius by the time I die
July 25th, 2013, 04:10 PM
Bay Area California
Experience: None
Platform: TT T4
Broker: Phillip Capital
Trading: Futures
Posts: 809 since Nov 2011
Thanks Given: 927
Thanks Received: 896
@josh
September 18th, 2014, 11:52 AM
boston
Experience: Intermediate
Platform: Sierra
Trading: ES
Posts: 4 since Sep 2010
Thanks Given: 0
Thanks Received: 0
well that seems perfect and plotted a nice line but at the wrong level.
September 18th, 2014, 12:12 PM
Tallinn, Estonia
Experience: Beginner
Platform: SC
Trading: NAS100
Posts: 958 since Nov 2010
Use Auto Retracement/Projection and plot only Level 3
September 18th, 2014, 04:21 PM
Georgia, US
Experience: None
Platform: SC
Broker: Denali+Teton
Trading: ES, NQ, YM
Posts: 6,331 since Jan 2011
Thanks Given: 6,955
Thanks Received: 18,632
pismo10
well that seems perfect and plotted a nice line but at the wrong level.
pismo10 lemons
September 19th, 2014, 04:24 PM
Oldenburg, Germany
Posts: 64 since Aug 2014
Thanks Given: 53
Thanks Received: 11
josh
@
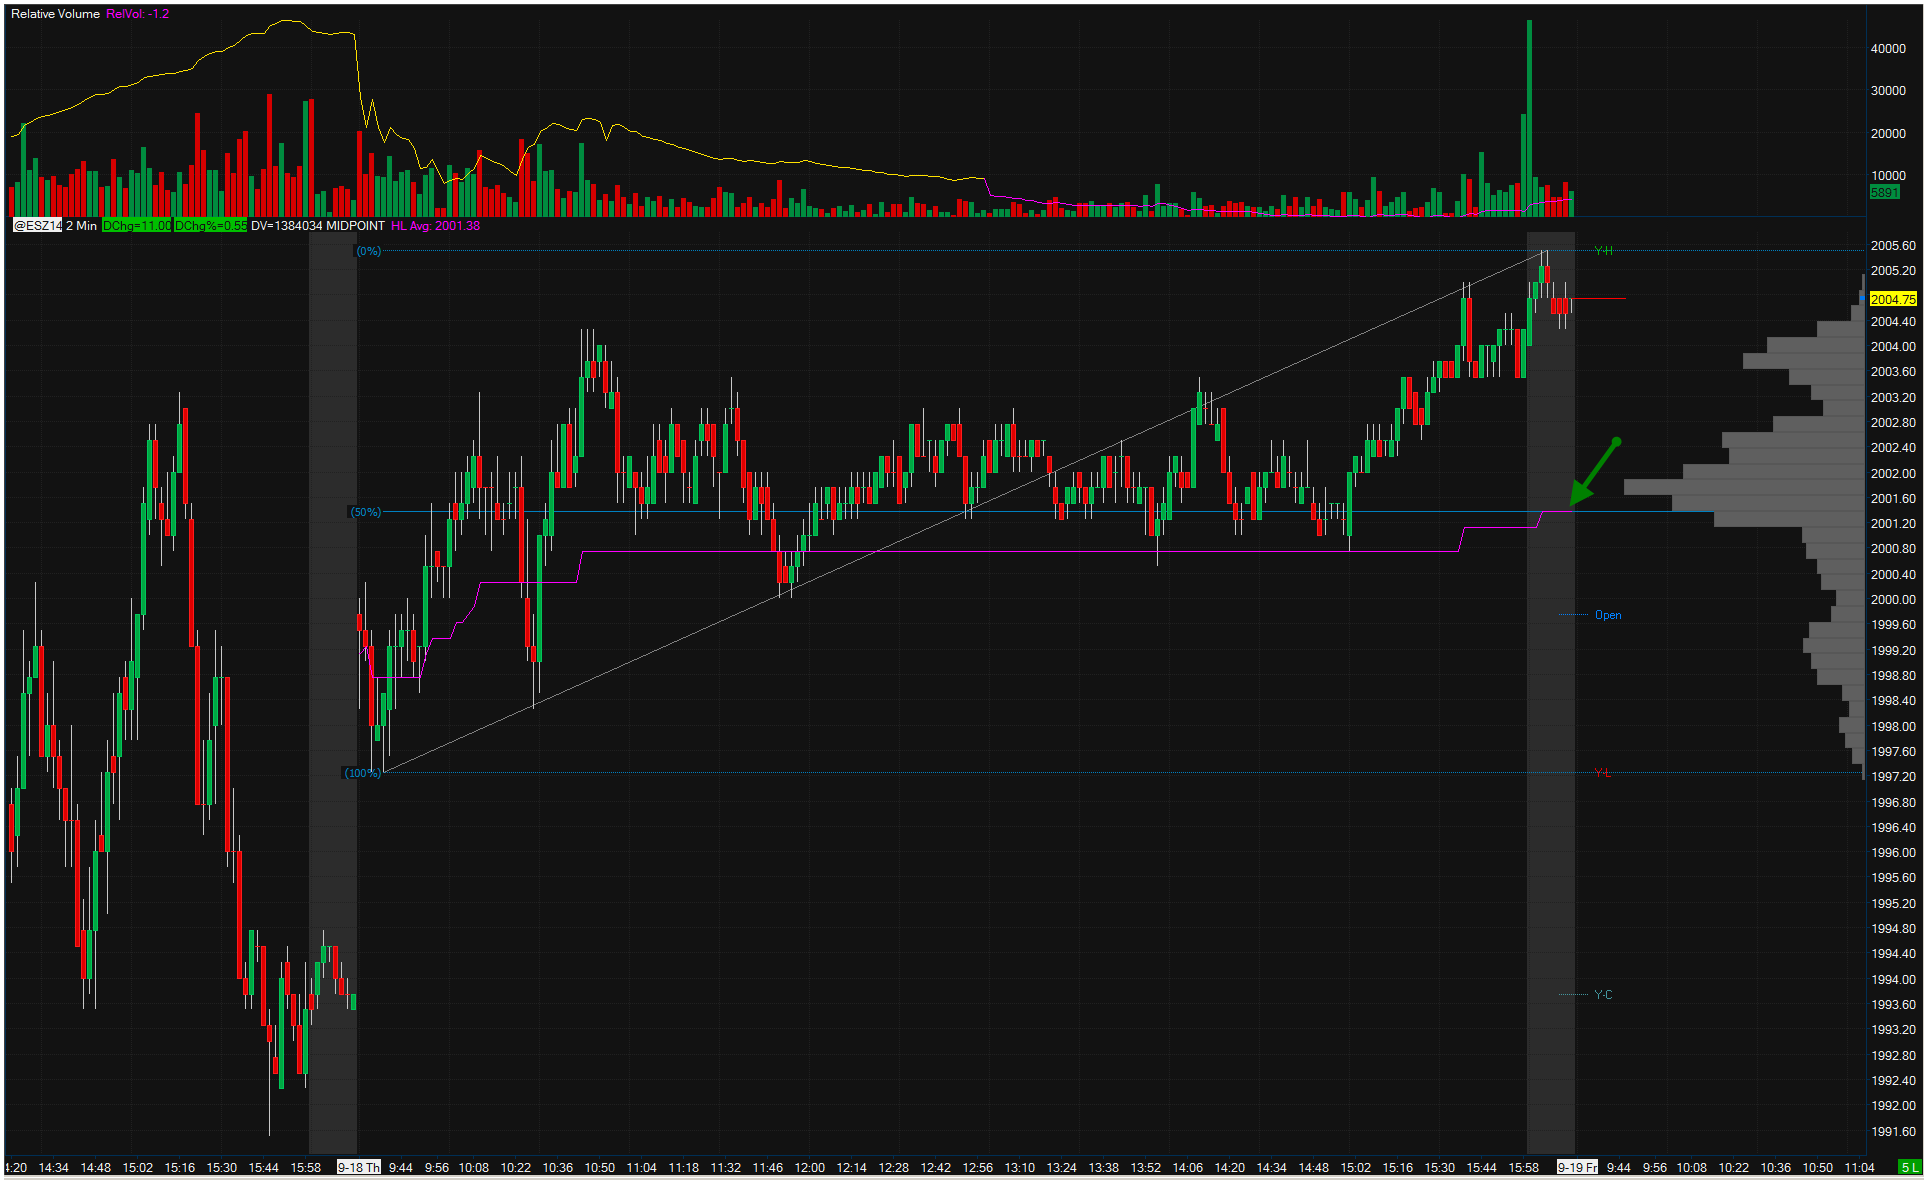
pismo10 , the method described above correctly plots the 50%. Check your settings. It's good to know another way to do it though, @
lemons .
50% level in purple.
September 19th, 2014, 04:26 PM
Georgia, US
Experience: None
Platform: SC
Broker: Denali+Teton
Trading: ES, NQ, YM
Posts: 6,331 since Jan 2011
Thanks Given: 6,955
Thanks Received: 18,632
arroganzmaschine
Is this a sierra chart screenshot?
September 20th, 2014, 04:04 AM
Oldenburg, Germany
Posts: 64 since Aug 2014
Thanks Given: 53
Thanks Received: 11
josh
Last Updated on September 20, 2014