NexusFi: Find Your Edge


Home Menu


NT priorDayOHLC


Discussion in NinjaTrader

Updated
    1. trending_up 2,538 views
    2. thumb_up 3 thanks given
    3. group 2 followers
    1. forum 2 posts
    2. attach_file 2 attachments


Search this Thread
  #1 (permalink)
 jitasb 
London, England
 
Experience: Intermediate
Platform: NinjaTrader
Broker: IB, Kinetic
Trading: Stocks
Posts: 513 since Oct 2010
Thanks Given: 22
Thanks Received: 226

Hello.

On using the Ninjtrader standard priordayOHLC. When the current day starts, it plots these lines ok, but it also plots these lines for the previous day. Is there a way to plot these lines so that nothing is shown for previous days. So once the current days starts it plots the previous day's OHLC but only on the current day : so in effect the indicator will start at market open of current day.

I have had a look at the settings on Indicators but there doesn't seem to be one to do this ?

The main reason is to just make it look a bit tidier and easier to see as the indicator plots vertical lines when it moves from previous day to current day. Have attached chart as example.

Many Thanks.


Visit my NexusFi Trade Journal Started this thread Reply With Quote

Can you help answer these questions
from other members on NexusFi?
Bookmap Global Plus Lifetime + Lifetime Addons For Sale
Platforms and Indicators
One Wallet Made $200K in Hours: AP Probes Polymarket Cea …
Prediction Markets & Event Contracts
Saylors 41-Month HODL Breaks: Strategy Sells 32 BTC as $ …
Prediction Markets & Event Contracts
CME Launches Bitcoin Volatility Futures June 1 -- First …
Cryptocurrency
Kharg Island at 6%, Regime Fall at 1.5% -- The Black Swa …
Prediction Markets & Event Contracts
 
Best Threads (Most Thanked)
in the last 7 days on NexusFi
Sober Journey With S&P
24 thanks
2026 Jlab journal
10 thanks
Lady Vols Primer: Trading Volatility Journal
8 thanks
Algo automated / semi-automated trading anyone?
6 thanks
Trying to learn Volume and price action correlation
5 thanks
  #3 (permalink)
 
Fat Tails's Avatar
 Fat Tails 
Berlin, Europe
Market Wizard
 
Experience: Advanced
Platform: NinjaTrader
Broker: Interactive Brokers
Trading: Futures & Stocks
Posts: 9,887 since Mar 2010
Thanks Given: 4,242
Thanks Received: 27,114


You can use the anaPivotsDailyV42 indicator from the SessionPivots which can be downloaded here:

https://nexusfi.com/download/ninjatrader-7/indicators/371-download.html


Required settings:

-> please set all plots that you do not need to transparent
-> set the range opacity to zero, if you do not want to display the ranges
-> set "Show prior days", if you do not want to wish to display the prior day HLC for all previous days
-> increase "Max. plot length # bars" as needed


Options:

-> the indicator allows you to display HLC from the regular session or the full session - a specific template is needed if you wish to display HLC from the regular session
-> you may select between the intraday close (last price traded of selected session) and daily close (with some datafeeds this is the settlement price)
-> the indicator does not show the prior day's open price

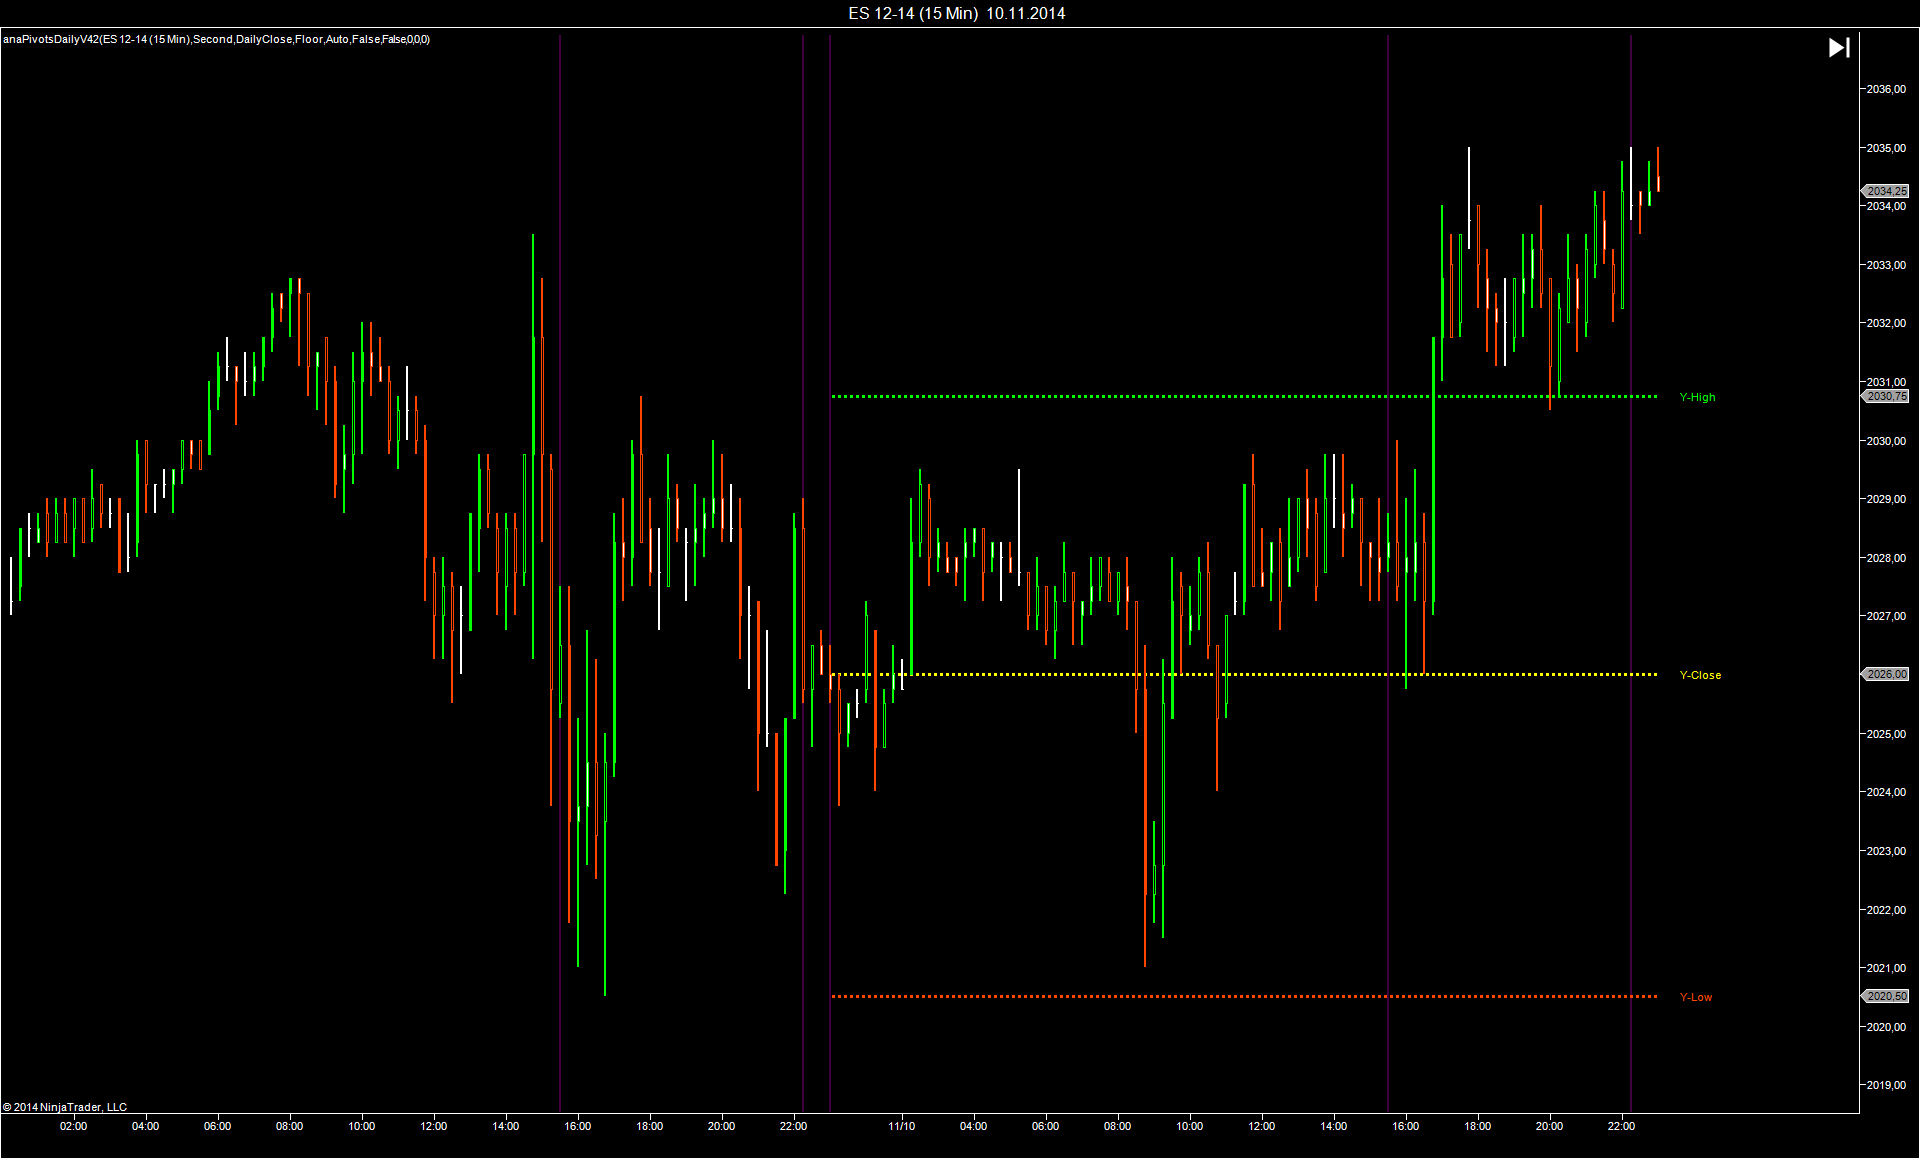
The chart attached shows the regular session high and low + the settlement price (volume-wiehgted average price between 3:14:30 and 3:15:00 PM CT) as taken from daily data


Reply With Quote
Thanked by:


Last Updated on November 11, 2014


© 2026 NexusFi®, s.a., All Rights Reserved.
Av Ricardo J. Alfaro, Century Tower, Panama City, Panama, Ph: +507 833-9432 (Panama and Intl), +1 888-312-3001 (USA and Canada)
All information is for educational use only and is not investment advice. There is a substantial risk of loss in trading commodity futures, stocks, options and foreign exchange products. Past performance is not indicative of future results.
About Us - Contact Us - Site Rules, Acceptable Use, and Terms and Conditions - Downloads - Top
no new posts