NexusFi: Find Your Edge


Home Menu


Pivots, Fibonacci, Demark, Woodies, ACD, Camarilla


Discussion in Sierra Chart

Updated
    1. trending_up 3,607 views
    2. thumb_up 11 thanks given
    3. group 1 followers
    1. forum 1 posts
    2. attach_file 2 attachments


Search this Thread
  #1 (permalink)
 
WilleeMac's Avatar
 WilleeMac 
Prospect, KY. USA
 
Experience: None
Platform: Sierra Chart
Broker: Infinity
Trading: /CL
Posts: 687 since Jan 2012
Thanks Given: 309
Thanks Received: 617

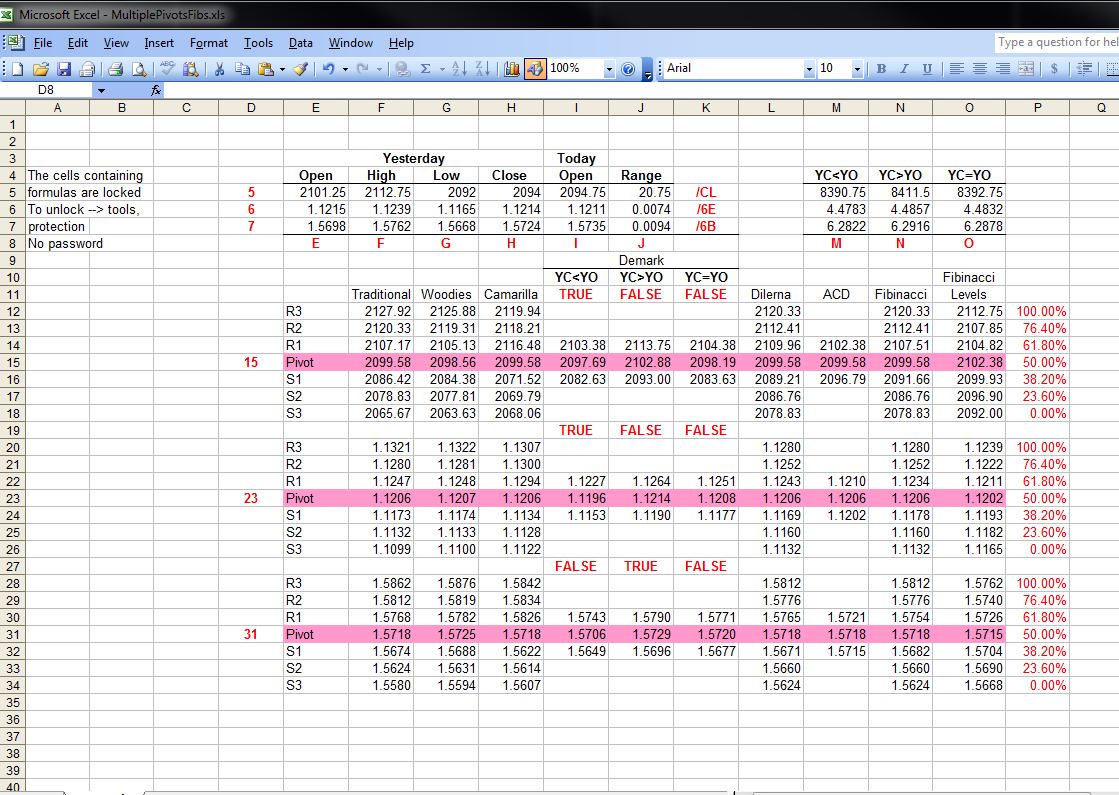
I have put together a spreadsheet for I think about every pivot known to man. The sheet is setup so you only have to enter daily data. The idea came from here Technical Analysis 2.0 | ToTheTick ? ToTheTick? . However as @Big Mike has put it; draw enough lines on a chart and something is sure to "stick." I agree. The point made by tothetick folks is look for confluence of the many different pivot formulas and you might have something.

Also the reason for doing this is I have problems here and there (nothing consistent other than frustration) with Sierra Chart pivot study referencing a daily chart for data. Sometimes Ok sometimes not. I've been through all of the documentation with no success, any suggestions are appreciated.

The spreadsheet helps with data for the Horizontal Lines study in SC.

Before I forget you can go to tothetick dot com and register your email for FREE daily fillable PDF's on all the majors - I esp like the data because they use settlement price for close


-William


Attached Files
Elite Membership required to download: MultiplePivotsFibs.xls
Follow me on X Started this thread Reply With Quote

Can you help answer these questions
from other members on NexusFi?
Hormuz Surges From 14% to 26.5% Intraday as Irans Answer …
Prediction Markets & Event Contracts
GDP Day: The First Economic Reckoning -- Pahlavi at 6.55 …
Prediction Markets & Event Contracts
Iran Airspace Collapses 18 Points to 15.5% While Hormuz …
Prediction Markets & Event Contracts
Warsh Opens Today, Hormuz June 19 -- WTI Below $80, Fran …
Prediction Markets & Event Contracts
Memorandum Watch: How the 60-Day MOU Framework Makes May …
Prediction Markets & Event Contracts
 
Best Threads (Most Thanked)
in the last 7 days on NexusFi
NexusFi site changelog and issues/problem reporting
15 thanks
Darmok and Jalad at Tanagra
3 thanks
Big Mike in Ecuador
1 thanks
30 Sessions
1 thanks
  #2 (permalink)
 
WilleeMac's Avatar
 WilleeMac 
Prospect, KY. USA
 
Experience: None
Platform: Sierra Chart
Broker: Infinity
Trading: /CL
Posts: 687 since Jan 2012
Thanks Given: 309
Thanks Received: 617

I received a question about the spreadsheet and values for /ES, specifically not fully calculating.

There's three "buckets" for entering data, one for product with two digits and two for four digits, ie .00 & .0000

It does not make make a difference what product is entered in what bucket, it is only how the cells are formatted - .0000 etc.

The spreadsheet is setup so that you need to enter today's open price (typically 1800ET) along with Yday prices.

You can enter any price you want, it's a spreadsheet - how do it know?

However it's up to you for the accuracy of the output.

Specifically answering the question presented - /ES works fine

-William

Follow me on X Started this thread Reply With Quote
Thanked by:


Last Updated on June 26, 2015


© 2026 NexusFi®, s.a., All Rights Reserved.
Av Ricardo J. Alfaro, Century Tower, Panama City, Panama, Ph: +507 833-9432 (Panama and Intl), +1 888-312-3001 (USA and Canada)
All information is for educational use only and is not investment advice. There is a substantial risk of loss in trading commodity futures, stocks, options and foreign exchange products. Past performance is not indicative of future results.
About Us - Contact Us - Site Rules, Acceptable Use, and Terms and Conditions - Downloads - Top
no new posts