Welcome to NexusFi: the best trading community on the planet, with over 200,000 members Sign Up Now for Free
Genuine reviews from real traders, not fake reviews from stealth vendors
Quality education from leading professional traders
We are a friendly, helpful, and positive community
We do not tolerate rude behavior, trolling, or vendors advertising in posts
We are here to help, just let us know what you need
You'll need to register in order to view the content of the threads and start contributing to our community. It's free for basic access, or support us by becoming an Elite Member -- discounts are available after registering.
-- Big Mike, Site Administrator
(If you already have an account, login at the top of the page)
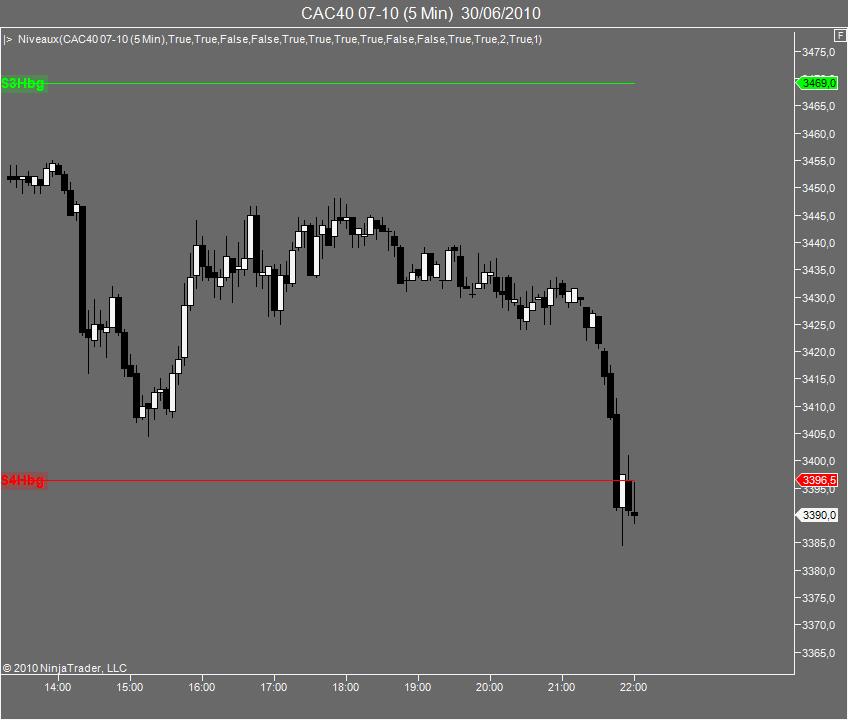
I'm building a sort of pivot indicator with plots as lines.
I'd like to leave an open space on the left of my screen on the left of the levels plotted as lines. It should be left empty wherever you browse through historical data.
I tried this code (interesting part in bold). But can't make it work. Can you help me ? Thank you
I need that because I have labels on the left of my levels and I don't want to offset them vertically because when you zoom out labels + levels become a mess.
I just need a trick to solve this problem, whatever it might be.
Thanks for your help
Can you help answer these questions from other members on NexusFi?
It has a modified plot override method, which allows to select the width of the pivot lines and plot labels to the right or to the left of those lines.