Welcome to NexusFi: the best trading community on the planet, with over 200,000 members Sign Up Now for Free
Genuine reviews from real traders, not fake reviews from stealth vendors
Quality education from leading professional traders
We are a friendly, helpful, and positive community
We do not tolerate rude behavior, trolling, or vendors advertising in posts
We are here to help, just let us know what you need
You'll need to register in order to view the content of the threads and start contributing to our community. It's free for basic access, or support us by becoming an Elite Member -- discounts are available after registering.
-- The NexusFi team
(If you already have an account, login at the top of the page)
Site Administrator Developer Swing Trader R.I.P. 1977-2026
Experience: Advanced
Platform: Custom solution
Broker: IBKR
Trading: Stocks & Futures
Frequency: Every few days
Duration: Weeks
Posts: 50,669 since Jun 2009
Thanks Given: 33,669
Thanks Received: 102,597
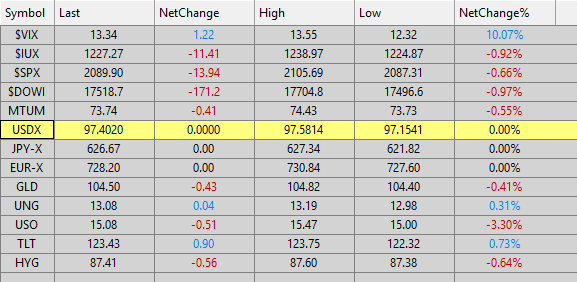
Anyone have any ideas why I am getting zero's on the net change value for USDX, JPY-X and EUR-X? All symbols are working fine on an individual chart and have real-time and historical data.
Site Administrator Developer Swing Trader R.I.P. 1977-2026
Experience: Advanced
Platform: Custom solution
Broker: IBKR
Trading: Stocks & Futures
Frequency: Every few days
Duration: Weeks
Posts: 50,669 since Jun 2009
Thanks Given: 33,669
Thanks Received: 102,597
Thanks for the quick reply. I really like these because they provide an overview for the currency. The charts work fine with OHLC values, and I am using the Percent change indicator without issue for long term charting.
Any idea on a work around? I wonder if Barchart has a similar index value for these symbols that would function here?
Site Administrator Developer Swing Trader R.I.P. 1977-2026
Experience: Advanced
Platform: Custom solution
Broker: IBKR
Trading: Stocks & Futures
Frequency: Every few days
Duration: Weeks
Posts: 50,669 since Jun 2009
Thanks Given: 33,669
Thanks Received: 102,597
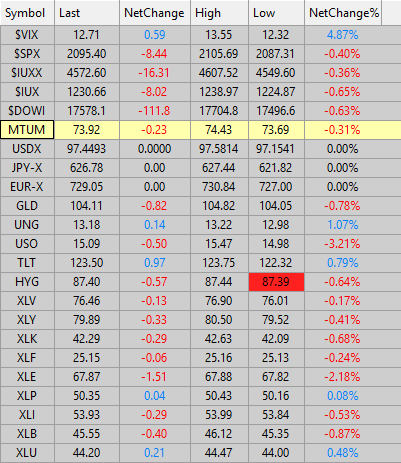
On a separate issue, the 'high' and 'low' seems to be wrong for the majority of instruments. I'm subscribed to real-time equities with Sierra/Barchart. Individual charts show correct values.
XLE should be 69.07/67.78, but shows 67.88/67.82 for example. The others are similar.
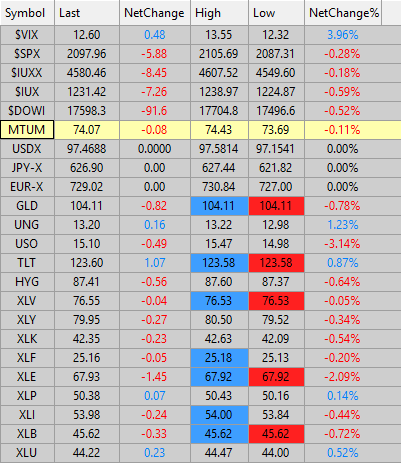
And as I was about to hit post, this happened:
With multiple instruments showing the high and low simultaneously.
Site Administrator Developer Swing Trader R.I.P. 1977-2026
Experience: Advanced
Platform: Custom solution
Broker: IBKR
Trading: Stocks & Futures
Frequency: Every few days
Duration: Weeks
Posts: 50,669 since Jun 2009
Thanks Given: 33,669
Thanks Received: 102,597
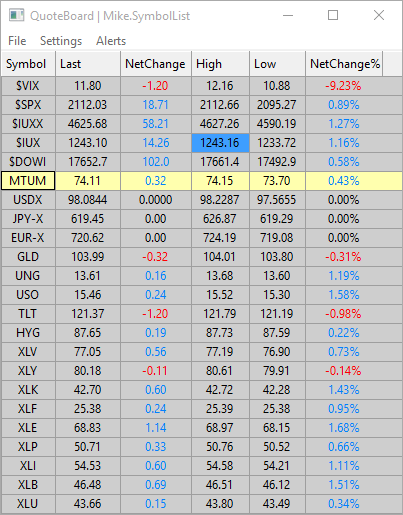
@SierraChart or anyone, any idea why the highs/lows are wrong for some instruments? I have real-time data from Sierra on these instruments and the charts are all fine.