NexusFi: Find Your Edge


Home Menu


Dynamic Yield Curve


Discussion in Stocks and ETFs

Updated
    1. trending_up 4,192 views
    2. thumb_up 1 thanks given
    3. group 1 followers
    1. forum 1 posts
    2. attach_file 1 attachments


Search this Thread
  #1 (permalink)
 jodistrict 
san diego
 
Experience: Intermediate
Platform: FXCM MarketScope, NT, Interactive brokers, AMP
Broker: FXCM, Interactive Brokers
Trading: FOREX, IWM, SPY, XLE, NQ
Posts: 228 since Apr 2010
Thanks Given: 72
Thanks Received: 145

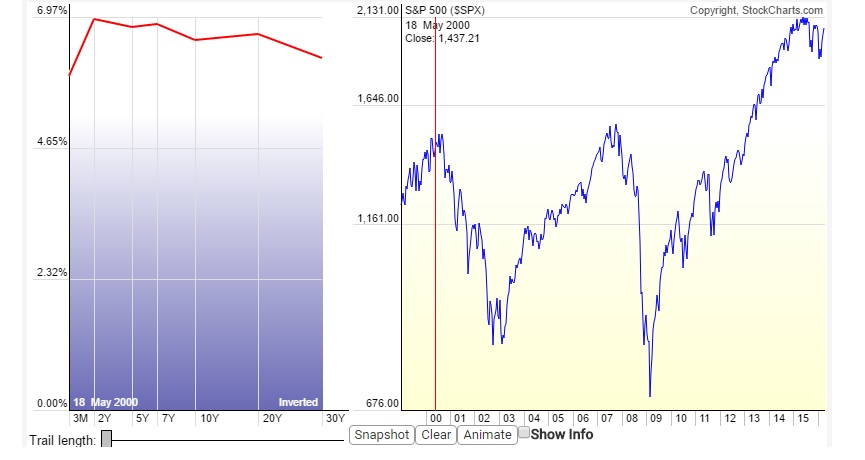
The website stockcharts.com has a neat free application called "Dynamic Yield Curve". Referring to the image below, the Interest rate pane is on the left and the S&P 500 plot is on the right. As you move the vertical line with your mouse on the S&P 500 pane, the left pane shows you what the yield curve was at that date. This application shows clearly how an inverted yield curve predicts a stock market top. In the graph below you can see that in 2000, there was an inverted yield curve (short term interest rates higher than long term interest rates) right before the crash.

Dynamic Yield Curve application

Dynamic Yield Curve - StockCharts.com - Free Charts

Documentation

Dynamic Yield Curve [Documentation]


Started this thread Reply With Quote
Thanked by:

Can you help answer these questions
from other members on NexusFi?
My Rant with AMP Futures
Trading Reviews and Vendors
requesting .nrd replay files from 2026 spy and qqq
The Elite Circle
EA
Platforms and Indicators
Datafeed for Atas
Platforms and Indicators
Trump Media to sell instant access to market-moving soci …
Traders Hideout
 
Best Threads (Most Thanked)
in the last 7 days on NexusFi
Mes vs MNQ
6 thanks
NexusFi site changelog and issues/problem reporting
5 thanks
BERN ALGOS algo trading journal
3 thanks
Johnnys Journal
2 thanks
TopStep Trader disappointment
2 thanks


Last Updated on April 17, 2016


© 2026 NexusFi®, s.a., All Rights Reserved.
Av Ricardo J. Alfaro, Century Tower, Panama City, Panama, Ph: +507 833-9432 (Panama and Intl), +1 888-312-3001 (USA and Canada)
All information is for educational use only and is not investment advice. There is a substantial risk of loss in trading commodity futures, stocks, options and foreign exchange products. Past performance is not indicative of future results.
About Us - Contact Us - Site Rules, Acceptable Use, and Terms and Conditions - Downloads - Top
no new posts


