Welcome to NexusFi: the best trading community on the planet, with over 150,000 members Sign Up Now for Free
Genuine reviews from real traders, not fake reviews from stealth vendors
Quality education from leading professional traders
We are a friendly, helpful, and positive community
We do not tolerate rude behavior, trolling, or vendors advertising in posts
We are here to help, just let us know what you need
You'll need to register in order to view the content of the threads and start contributing to our community. It's free for basic access, or support us by becoming an Elite Member -- see if you qualify for a discount below.
-- Big Mike, Site Administrator
(If you already have an account, login at the top of the page)
Trading Calendar generated by TimingSolution for AMD during March, 2017. Green Arrow is a pivot up and a Red Arrow is a pivot down. The time of day for the pivots is also displayed. This calculation is done with EOD data; however, calculations can be done for live intraday data also.
Hi Gio, are you the guy that people are talking about when they say that Gio can predict the time of turns so well that it is scary?
If so I think that is pretty cool and do you share info? I am relatively new to this but I have seen some pretty cool Planetary Lines. I want to learn more of TIME.
Interplanetary collision between the Moon, Fibonacci and the Avengers happens only every seven years. He will be back in two.
Matt Z
Optimus Futures
Trading futures and options involves substantial risk of loss and is not suitable for all investors. Past performance is not necessarily indicative of future results. You may lose more than your initial investment. All posts are opinions and do not claim to be facts. Please conduct your own due diligence. Use only Risk capital when trading Futures.
1 800 771 6748 local 561 367 8686 email [email protected]
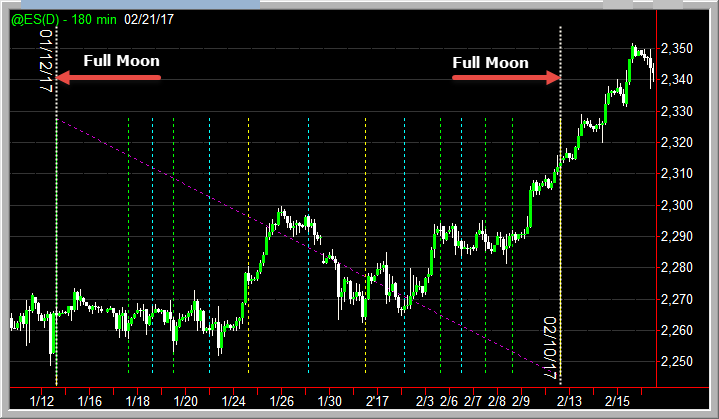
I have to admit after seeing price action at some of the planetary lines there is something going on there. Matt Z, have you ever seen planetary lines over the ES?
More of a collision between price action and a planet's longitude. Anyway, I just found your YouTube videos and it seems you know a lot about trading. I think Planetary Lines are just another way to seeking a profit.
I think we as humans trying hard find correlations between things, and given enough time, we convince ourselves that the relationship does exist.
You will quite often find it with the folks who say "I am invested in my indicators" as if the loss of these indicators would mean it would be impossible to trade. This is precisely because they found a correlation between price movements and their signals. However, finding relationships between things is one thing, but finding quantifiable correlations that you base a method on is different. Most rely on intuition, which is neither quantifiable or has risk management.
If you can build a method around interplanetary, go for it. I would not touch with a ten-foot pole because I lack the time for "looks interesting". It takes away time from productive pursuits.
Matt Z
Optimus Futures
There is a substantial risk of loss in futures trading. Past performance is not indicative of future results.
Trading futures and options involves substantial risk of loss and is not suitable for all investors. Past performance is not necessarily indicative of future results. You may lose more than your initial investment. All posts are opinions and do not claim to be facts. Please conduct your own due diligence. Use only Risk capital when trading Futures.
1 800 771 6748 local 561 367 8686 email [email protected]