Welcome to NexusFi: the best trading community on the planet, with over 150,000 members Sign Up Now for Free
Genuine reviews from real traders, not fake reviews from stealth vendors
Quality education from leading professional traders
We are a friendly, helpful, and positive community
We do not tolerate rude behavior, trolling, or vendors advertising in posts
We are here to help, just let us know what you need
You'll need to register in order to view the content of the threads and start contributing to our community. It's free for basic access, or support us by becoming an Elite Member -- see if you qualify for a discount below.
-- Big Mike, Site Administrator
(If you already have an account, login at the top of the page)
I use several different tick bars for tape reading, length and closes of the bars are of great importance to me. Tick bars partition the action into traded unities, so you have short bars (high activity within small price range) and long bars (lower activity within larger price range, because of same amount of traded units as in short bars).
A wide-range-bar which closes in the upper third or lower third of the OHLC body is indicative for me, but only in it's tape reading context. E.G. a sell-off : if last and lowest bar is a WRB, but WRB closes in upper third, it could mean that the sell-off has stopped and a (at least) pullback is imminent. Swing traders' delight.
Also: Practice has proven that under certain circumstances several bar closes outside specific trend areas indicate a trend reversal.
On and on it goes.
But I agree: there is no use of the closing in time based bars. Never was. Never will be. At least for me.
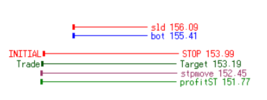
I don't explain my charts. If you like to follow my trades, look for these lines.
It all makes sense -- I use bars the same way, except mine are volume based. That is, a tall bar has a different meaning from a short bar. But one thing I don't get still: let's say your last and lowest bar is a WRB in a selloff, and the market rebounds higher and is trading in the upper third. Why does it need to close, to trigger a buy for you? What is it about the last trade that's so important?
Thanks for asking. In this old example I get several WRB with closes even at the top. That concludes the idea, that the overall structure is a trend reversing structure, more or less. Hope you can see it. It is an old pic which I can't modify right now.
I don't explain my charts. If you like to follow my trades, look for these lines.
Test 1 and 2 of the bottom are WRB's with distinctive closes above, whereas Test 3 (trigger signal) consists of two subsequent WRB's. I buy the first pullback...
I do a lot of bar-to-bar work, means: I step bar-by-bar forward (approx 20-40 bars) until I reach the NOW. If I get a feeling about the market, the contract is under observation, if I don't, I go to the next market.
I don't explain my charts. If you like to follow my trades, look for these lines.
And I am not so much an intraday trader. If my trade stays 4-6 days for good, it is a very profitable trade and reflects the average swing on a daily chart.
I don't explain my charts. If you like to follow my trades, look for these lines.
So, if you made those bars in your chart HL bars only, with no open or close, you wouldn't have enough information to take the trade you want?
Several of the bars on the last test lower closed below your line. I don't see anywhere in there where the actual close makes any kind of difference in the overall structure.
I followed this thread to see what bits of wisdom you were going to share with us beyond your original post.
So far it's been interesting to read how others have reacted to your comment(s), in some cases almost in defense of their belief.
You mentioned you think the close of a weekly bar or candle has some importance and you suggested a weekly bar close has more importance than a daily bar or candle close because the "global" markets are closed for the weekend.
I found these exceptions to your original statement interesting in that it lead me to believe you may not subscribe to the notion that the markets are fractal. I don't actually know what you believe in that regard but I found it interesting.
I don't actually know if I put any more weight on "The Close" of a bar or a candle, but I do look at them as part of my way of looking at any instrument I might decide to trade.
Not so much to assign any particular value or weighting to the close of the bar, but I do look at a bar close in concert with what the following bar does to gauge if a move is just getting started or is slowing down before a pullback or even possibly signalling that the move is coming to an end.
Regardless of what my beliefs are, we all look at things differently. Those differences are what makes the market.
Great thread, thanks for getting it going.
Trade well.
R.I.P. John Bottomley (Botts), 1956-2022.
Please visit this thread for more information.
Its the context, not the closes per se. I don't trade only from closes of a bar, I like to see closes, within clusters, certain structure, short term price pattern etc.
In this specific example I had 3 tests of a downside door (incorporated by WRB close-up), door did not open. Last test performs inside resilient cluster, door didn't open for breakdown. At the same time the overall structure shows lower highs which could have been upper part of descending (bearish) triangle. In my experience a descending bearish triangle does not show a base like that with distinctive rejections of price level. Again, that's discretionary perceived.
Thank you.
I don't explain my charts. If you like to follow my trades, look for these lines.
Sorry to disappoint you with no wisdom following :-D -- I have my opinions about this for sure, but I purposely have avoided talking about anything I do, to let this topic and thread stand on its own. This purpose of this thread really is to get people to think about what they do, and not to simply do things "by default" or because they see others doing them. In a trade, you have to follow the herd in order to avoid being trampled, but when it comes to developing a strategy, your own personal view of the market based on logic you accept because you have intentionally thought about things is critical, IMO, and it's suicide to follow the herd in this aspect.
That's very insightful -- hopefully it's not too much of a cop out to say that I think they're *somewhat* fractal. We're talking about buying/selling patterns and the various reasons for that, and on a day timeframe, those motivations and resulting capital positioning are vastly different from an investor buying long term, for example. However, you still do see similar patterns on all timeframes -- capitulation, based in fear, happens regardless of what part of the flow of transactions you zoom in to.
Volume patterns certainly are not fractal -- there are times of the trading session when volume will almost always be higher than others, barring news. There are times of the year due to holidays and seasonality which tend to be higher in volume than others, again, all other things being equal.
The time of day regulates market opportunity, which is MP-speak; but one thing this means is that as the close approaches, those with decisions to make (do I hold this overnight? do I buy more?) come closer and closer to being forced to make that decision. So, you will often see markets do strange things during the last hour of trade, like ramp higher or sell off hard, that they don't do as often during the lunch hour, because the window of opportunity is closing. This fact alone, though basic as it is, sometimes eludes people who seem to think that getting in a trade at 12:00 is equivalent to getting in the same trade (same price, same structure, etc.) at 3pm (how many times have you gotten in a trade at 1pm, it works a little bit, comes back, bounces around your entry, stops you out for a 9 tick loss, and then near the close it suddenly works in the span of 15 minute?). They're not the same, by any stretch, and in this way, the market certainly is not fractal.
Last thought here, about your charts you posted. The top one says "multiple bar closes here fail to move higher" -- however, the bottom chart also has a consolidation which does result in a continuation higher. So, do the bar closes, which on this renko chart are simply consecutive alternating up/down closes, really matter? Isn't the key factor here that this is a consolidation? Looking at the time of day of your top chart, what actually happened immediately after was a continuation higher into the close. This proves nothing, of course, except to say that there was a consolidation, the market needed to go marginally lower to fuel one last leg higher into the close -- the close of the day, with participants rushing to position themselves, played a far larger factor, than bar closes generated as a derivation of transactions, didn't it? Increase your periodicity there by a tick or two, and you would have had a single renko candle for the entire consolidation, no closes even registered.
This choosing of the periodicity, the type of bar, all of it -- are chosen by you and me -- not by the market. Allowing the market to speak for itself is the most important thing we can do, and imposing our own structure must be done very carefully so as not to attribute some meaning to the market which is, in reality, meaning that we are ourselves imposing upon it. Yes, fully opinionated there, and not in any way to suggest your chart is somehow inferior to anything I use, simply stating my view.
To be clear, my screenshots (roughly 10 minutes apart) were chosen simply to help illustrate my comment: "Not so much to assign any particular value or weighting to the close of the bar, but I do look at a bar close in concert with what the following bar does..."
I wasn't suggesting it proves anything, I was simply discussing how I look at a bar close as part of what happens next.
In regards to your comment about my choice of bar type or periodicity, I prefer to use choices that "speak to me", choices that I believe help me interpret what the market is saying to me, "Allowing the market to speak for itself"
I don't want to sound defensive here, I'm not defending my choices, they are what they are, and they do change over time as my own interpretation of what I think the market is saying to me changes.
Thanks again.
R.I.P. John Bottomley (Botts), 1956-2022.
Please visit this thread for more information.


 I don't explain my charts. If you like to follow my trades, look for these lines.

