NexusFi: Find Your Edge


Home Menu


Looking for help identifying an indicator


Discussion in NinjaTrader

Updated
    1. trending_up 1,385 views
    2. thumb_up 2 thanks given
    3. group 2 followers
    1. forum 1 posts
    2. attach_file 1 attachments


Search this Thread
  #1 (permalink)
 booker777 
Augusta, GA
 
Experience: Advanced
Platform: NT
Trading: ES, TF
Posts: 100 since Feb 2011
Thanks Given: 36
Thanks Received: 24

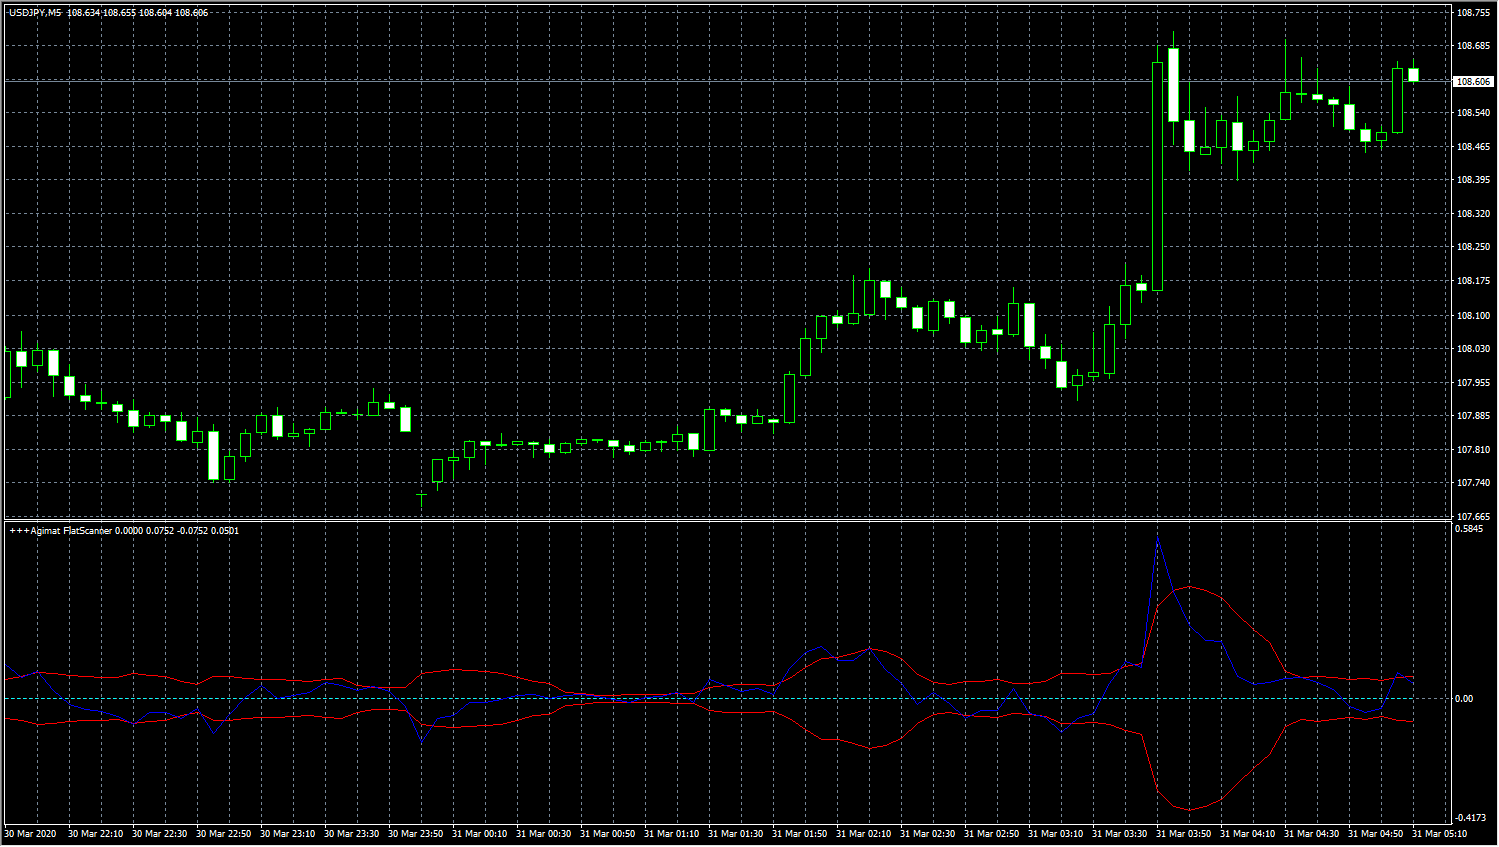
Does anyone recognize the indicator below this chart? It is labelled as Agimat Flatscanner which is an MT4 indicator. Does anyone recognize what type of indicator it is and if there is anything similar here at NexusFi. Tks


Started this thread Reply With Quote

Can you help answer these questions
from other members on NexusFi?
White House Drops First Alien Files Today -- Market Says …
Prediction Markets & Event Contracts
NinjaTrader Parent Payward Acquires Bitnomial for $550M …
Platforms and Indicators
Prediction Markets Lock Fed Pause at 99pct for April 29 …
Prediction Markets & Event Contracts
May 26 Deadline Dies at 7.5% as US Strikes Iran During C …
Prediction Markets & Event Contracts
$24.5 Billion Record Month: Prediction Markets Shatter A …
Prediction Markets & Event Contracts
 
Best Threads (Most Thanked)
in the last 7 days on NexusFi
Sober Journey With S&P
24 thanks
2026 Jlab journal
10 thanks
Algo automated / semi-automated trading anyone?
6 thanks
Lady Vols Primer: Trading Volatility Journal
6 thanks
Trying to learn Volume and price action correlation
5 thanks
  #2 (permalink)
 milehightrader 
Tampa FL
 
Experience: Intermediate
Platform: NinjaTrader, Jigsaw
Broker: NinjaTrader Clearing, Rithmic
Trading: MNQ, MES
Posts: 39 since Mar 2020
Thanks Given: 13
Thanks Received: 18

Doing a cursory google search:

https://www.agimat-trading-system.com/

and

https://fxprosystems.com/market-scanner-system/

https://www.forexstrategiesresources.com/binary-options-strategies-ii/170-market-scanner-system/

From the last link: Tips: "enter when the bands have widened, because the market is more volatile."

I wonder if the red bands are Bollinger bands? Not sure what the blue signal line is.


Reply With Quote
Thanked by:


Last Updated on April 1, 2020


© 2026 NexusFi®, s.a., All Rights Reserved.
Av Ricardo J. Alfaro, Century Tower, Panama City, Panama, Ph: +507 833-9432 (Panama and Intl), +1 888-312-3001 (USA and Canada)
All information is for educational use only and is not investment advice. There is a substantial risk of loss in trading commodity futures, stocks, options and foreign exchange products. Past performance is not indicative of future results.
About Us - Contact Us - Site Rules, Acceptable Use, and Terms and Conditions - Downloads - Top
no new posts