NexusFi: Find Your Edge


Home Menu


Auto Retracement/ Projection study question


Discussion in Sierra Chart

Updated
    1. trending_up 1,355 views
    2. thumb_up 0 thanks given
    3. group 2 followers
    1. forum 1 posts
    2. attach_file 2 attachments


Search this Thread
  #1 (permalink)
 
Brookwood's Avatar
 Brookwood 
Brooklyn, NY
 
Experience: Intermediate
Platform: Sierra
Trading: GC, CL, Indexes
Posts: 21 since Jun 2010
Thanks Given: 50
Thanks Received: 9

I started trying to post this at Sierra but after struggling for an hour to comply with their laborious chart posting requirements after I had screen-capped them already, I gave up.
Anyway, my query may also lead to a more general question, or answer, about how Sierra studies behave:
For this study IIUC--not guaranteed-- if the subgraph param "Reference to Single Subgraph" is set to "Yes", the values should reference Highs and/ or Lows when calculating the retracements. However they seem to be referencing bar opens.
"No", which I believe is used to reference other studies in its calculations displays what I believe to be the "correct" values, clearly shown highs and lows.
What other study would this be referencing if not itself?
I do have a Daily Open study a few studies above if that's a clue.
Anyway, interesting to chart the highest/ lowest opens vs furthest extremes.

[Edit: I see the incorrect row is highlighted in the first pic. It should be "Reference Single Subgraph as the 2nd pic below it].
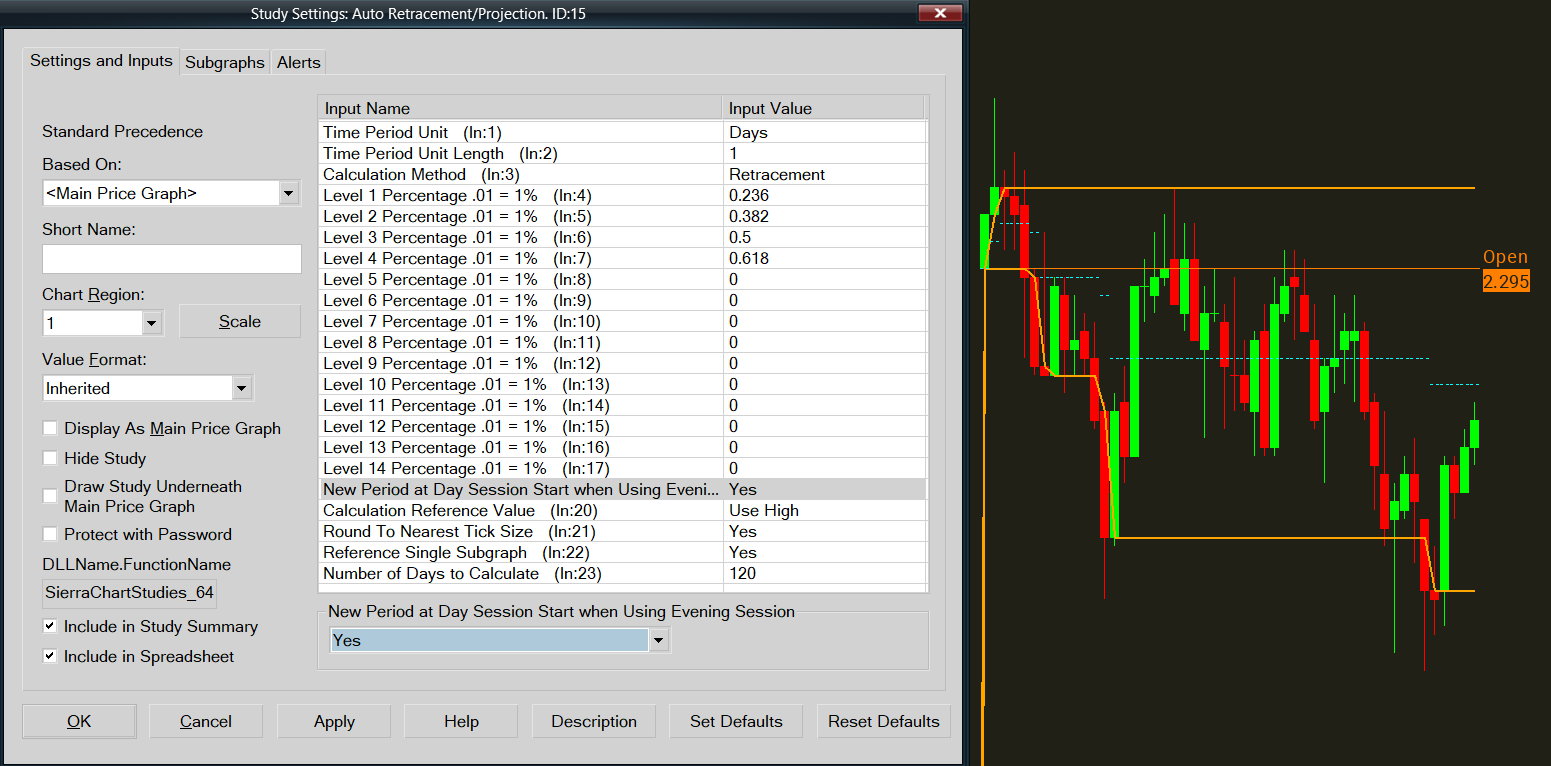
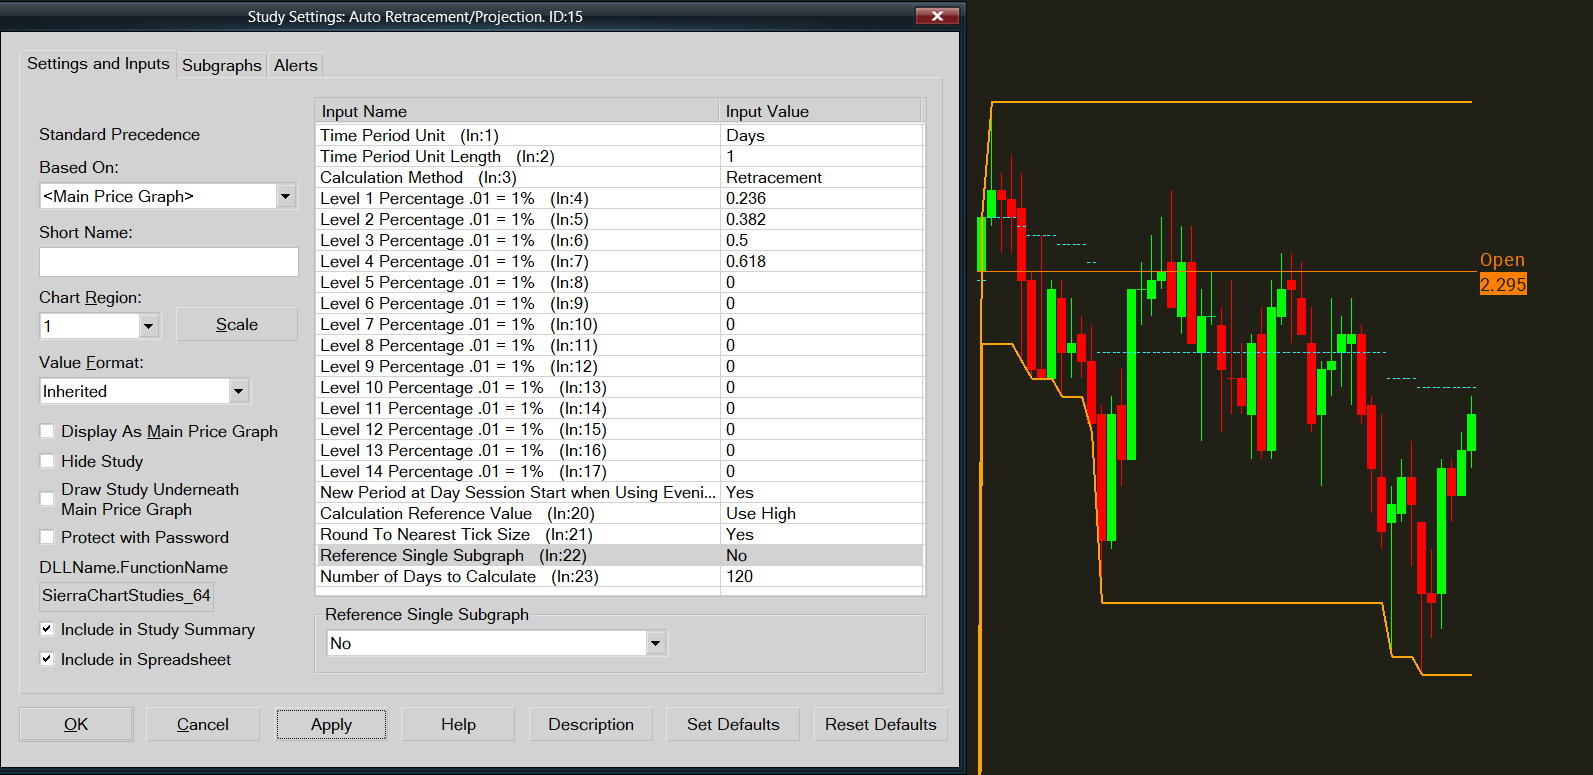

Started this thread Reply With Quote

Can you help answer these questions
from other members on NexusFi?
No book, only a stair: journaling fills where price move …
Cryptocurrency
My Rant with AMP Futures
Trading Reviews and Vendors
EA
Platforms and Indicators
[WTS] ATAS Lifetime ULTRA license – EU buyers only – …
Platforms and Indicators
I developed a free AI-powered (Kronos) forecasting indic …
The Elite Circle
 
Best Threads (Most Thanked)
in the last 7 days on NexusFi
Would you consider buying or leasing an algo?
6 thanks
Trading Journal (Neural Network Production Pipeline Mode …
4 thanks
Trading psychology articles
4 thanks
Big Mike in Ecuador
3 thanks
The Scalpers Journey
2 thanks
  #2 (permalink)
bradhouser
Northern California where the girls are warm
 
Posts: 125 since Nov 2010
Thanks Given: 16
Thanks Received: 72

I don't know if you are aware, but clicking the Description button opens the documentation for the study: https://www.sierrachart.com/index.php?page=doc/StudiesReference.php&ID=169

It appears you need to change a setting to get what you are looking for.


Reply With Quote


Last Updated on April 23, 2023


© 2026 NexusFi®, s.a., All Rights Reserved.
Av Ricardo J. Alfaro, Century Tower, Panama City, Panama, Ph: +507 833-9432 (Panama and Intl), +1 888-312-3001 (USA and Canada)
All information is for educational use only and is not investment advice. There is a substantial risk of loss in trading commodity futures, stocks, options and foreign exchange products. Past performance is not indicative of future results.
About Us - Contact Us - Site Rules, Acceptable Use, and Terms and Conditions - Downloads - Top
no new posts