NexusFi: Find Your Edge


Home Menu


SuperDOM with a corresponding price line/crosshair on the chart?


Discussion in NinjaTrader

Updated
      Top Posters
    1. looks_one AlDon with 1 posts (0 thanks)
    2. looks_two RatMonkey with 1 posts (0 thanks)
    3. looks_3 DavidHP with 1 posts (0 thanks)
    4. looks_4 DowDaddy with 1 posts (0 thanks)
    1. trending_up 2,009 views
    2. thumb_up 0 thanks given
    3. group 7 followers
    1. forum 3 posts
    2. attach_file 2 attachments


Search this Thread
  #1 (permalink)
 RatMonkey 
Bangkok Thailand
 
Experience: Intermediate
Platform: Ninjatrader
Trading: Futures, S&P 500
Frequency: Daily
Duration: Minutes
Posts: 9 since Oct 2022
Thanks Given: 6
Thanks Received: 7

Hello, I think this is my first post on there. If this lands in the wrong sub forum, apologies. Im still getting familiar.

I use a price action scalping strategy thats based entirely on market structure & support/resistance, utilizing the chart trader. I never look at the Y-Axis on the chart and couldn't tell you what price level we are at.

I want to start using the SuperDOM because im told its faster for order entry internally, but I can not take my eye off of the bars printing on the chart for long enough to look at the level on the Y-Axis of the chart and find its corresponding level on the DOM. It takes too long and is extremely cumbersome for my strategy.

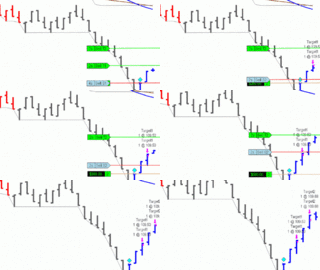
Think or Swim has a built in feature that basically has a correlating price line/crosshair that goes across the chart at the same level of your mouse as its hovering over a price in the DOM.

I borrowed the attached images from the internet because they are good at illustrating what Im trying to do. I no longer use TOS.

Does anyone know how to achieve this? Its a very handy and accurate way to enter the market.


Started this thread Reply With Quote

Can you help answer these questions
from other members on NexusFi?
My Rant with AMP Futures
Trading Reviews and Vendors
No book, only a stair: journaling fills where price move …
Cryptocurrency
What we know about Binances $6.3bn hack - BBC News
Cryptocurrency
Building a free browser DOM/SMC simulator - need some ad …
Platforms and Indicators
requesting .nrd replay files from 2026 spy and qqq
The Elite Circle
 
  #2 (permalink)
 AlDon 
Melbourne Victoria/Australia
 
Experience: Advanced
Posts: 16 since Dec 2019
Thanks Given: 4
Thanks Received: 9


RatMonkey View Post
Hello, I think this is my first post on there. If this lands in the wrong sub forum, apologies. Im still getting familiar.

I use a price action scalping strategy thats based entirely on market structure & support/resistance, utilizing the chart trader. I never look at the Y-Axis on the chart and couldn't tell you what price level we are at.

I want to start using the SuperDOM because im told its faster for order entry internally, but I can not take my eye off of the bars printing on the chart for long enough to look at the level on the Y-Axis of the chart and find its corresponding level on the DOM. It takes too long and is extremely cumbersome for my strategy.

Think or Swim has a built in feature that basically has a correlating price line/crosshair that goes across the chart at the same level of your mouse as its hovering over a price in the DOM.

I borrowed the attached images from the internet because they are good at illustrating what Im trying to do. I no longer use TOS.

Does anyone know how to achieve this? Its a very handy and accurate way to enter the market.

I'm in the same boat when I try to enter with the DOM.
I'm hovering around the chart with the middle mouse button to find bar highs etc. Then mentally adding/subtracting a tick before heading back to the DOM to mouse wheel the ladder and find the price I want.

I have been wanting the same thing with the mouse link!

Since most of my trades are entered after the bar closes I created a "Previous Bar High/Low" indicator for use with the SuperDOM because it was simple and quick. It paints two orange lines at the high and low of the previous bar of whatever timeframe chart you set in the parameters. I don't use it much because I mainly use a tick chart and wouldn't trust the bars to line up with what I'm seeing on the chart versus whatever the tick count has ended up at on the SuperDOM window ( If there even was a difference )

I'll share it if you are interested. It's super basic. I suspect, like me you would want to also set orders at swing highs/lows and other points as well. So it's probably not of much use in other cases.

As I write this I'm tempted now to try and do a mouse link somehow. . I'm just a little weary of thread locking my trading chart ( or SuperDOM ) if not done correctly. Also a little tight with spare time right now.


Reply With Quote
  #3 (permalink)
 
DavidHP's Avatar
 DavidHP 
Isla Mujeres, MX
Legendary Market Wizard
 
Experience: Advanced
Platform: NinjaTrader
Broker: Ninjatrader / Optimus Futures / AmpFutures
Trading: NQ / ES / 6E / 6B / CL
Frequency: Every few days
Duration: Minutes
Posts: 1,830 since Aug 2009
Thanks Given: 11,805
Thanks Received: 3,057


You may want to consider either of these:
Eds Level2 V4.4:
John Thom's jtRealStats indicator


RatMonkey View Post
Hello, I think this is my first post on there. If this lands in the wrong sub forum, apologies. Im still getting familiar.

I use a price action scalping strategy thats based entirely on market structure & support/resistance, utilizing the chart trader. I never look at the Y-Axis on the chart and couldn't tell you what price level we are at.

I want to start using the SuperDOM because im told its faster for order entry internally, but I can not take my eye off of the bars printing on the chart for long enough to look at the level on the Y-Axis of the chart and find its corresponding level on the DOM. It takes too long and is extremely cumbersome for my strategy.

Think or Swim has a built in feature that basically has a correlating price line/crosshair that goes across the chart at the same level of your mouse as its hovering over a price in the DOM.

I borrowed the attached images from the internet because they are good at illustrating what Im trying to do. I no longer use TOS.

Does anyone know how to achieve this? Its a very handy and accurate way to enter the market.


Rejoice in the Thunderstorms of Life . . .
Knowing it's not about Clouds or Wind. . .
But Learning to Dance in the Rain ! ! !
Follow me on X Reply With Quote
  #4 (permalink)
 
DowDaddy's Avatar
 DowDaddy 
Las Vegas
 
Experience: Master
Platform: Ninja
Broker: Ninja Trader Brokerage
Trading: Nasdaq Futures
Posts: 405 since Oct 2021
Thanks Given: 771
Thanks Received: 400


AlDon View Post
I'm in the same boat when I try to enter with the DOM.

I'm hovering around the chart with the middle mouse button to find bar highs etc. Then mentally adding/subtracting a tick before heading back to the DOM to mouse wheel the ladder and find the price I want.


I have been wanting the same thing with the mouse link!


Since most of my trades are entered after the bar closes I created a "Previous Bar High/Low" indicator for use with the SuperDOM because it was simple and quick. It paints two orange lines at the high and low of the previous bar of whatever timeframe chart you set in the parameters. I don't use it much because I mainly use a tick chart and wouldn't trust the bars to line up with what I'm seeing on the chart versus whatever the tick count has ended up at on the SuperDOM window ( If there even was a difference )


I'll share it if you are interested. It's super basic. I suspect, like me you would want to also set orders at swing highs/lows and other points as well. So it's probably not of much use in other cases.


As I write this I'm tempted now to try and do a mouse link somehow. . I'm just a little weary of thread locking my trading chart ( or SuperDOM ) if not done correctly. Also a little tight with spare time right now.


I'd love that

Sent using the NexusFi mobile app


Visit my NexusFi Trade Journal Reply With Quote


Last Updated on October 6, 2023


© 2026 NexusFi®, s.a., All Rights Reserved.
Av Ricardo J. Alfaro, Century Tower, Panama City, Panama, Ph: +507 833-9432 (Panama and Intl), +1 888-312-3001 (USA and Canada)
All information is for educational use only and is not investment advice. There is a substantial risk of loss in trading commodity futures, stocks, options and foreign exchange products. Past performance is not indicative of future results.
About Us - Contact Us - Site Rules, Acceptable Use, and Terms and Conditions - Downloads - Top
no new posts