|
St. Louis
Experience: Beginner
Platform: thinkorswim, NT8
Trading: equity and fx futures and options
Posts: 135 since Sep 2013
Thanks Given: 99
Thanks Received: 192
|
I struggle with the same question. I made a comparison this morning after being frustrated last week. It will either help or further obfuscate, but seemed to be an appropriate thread.
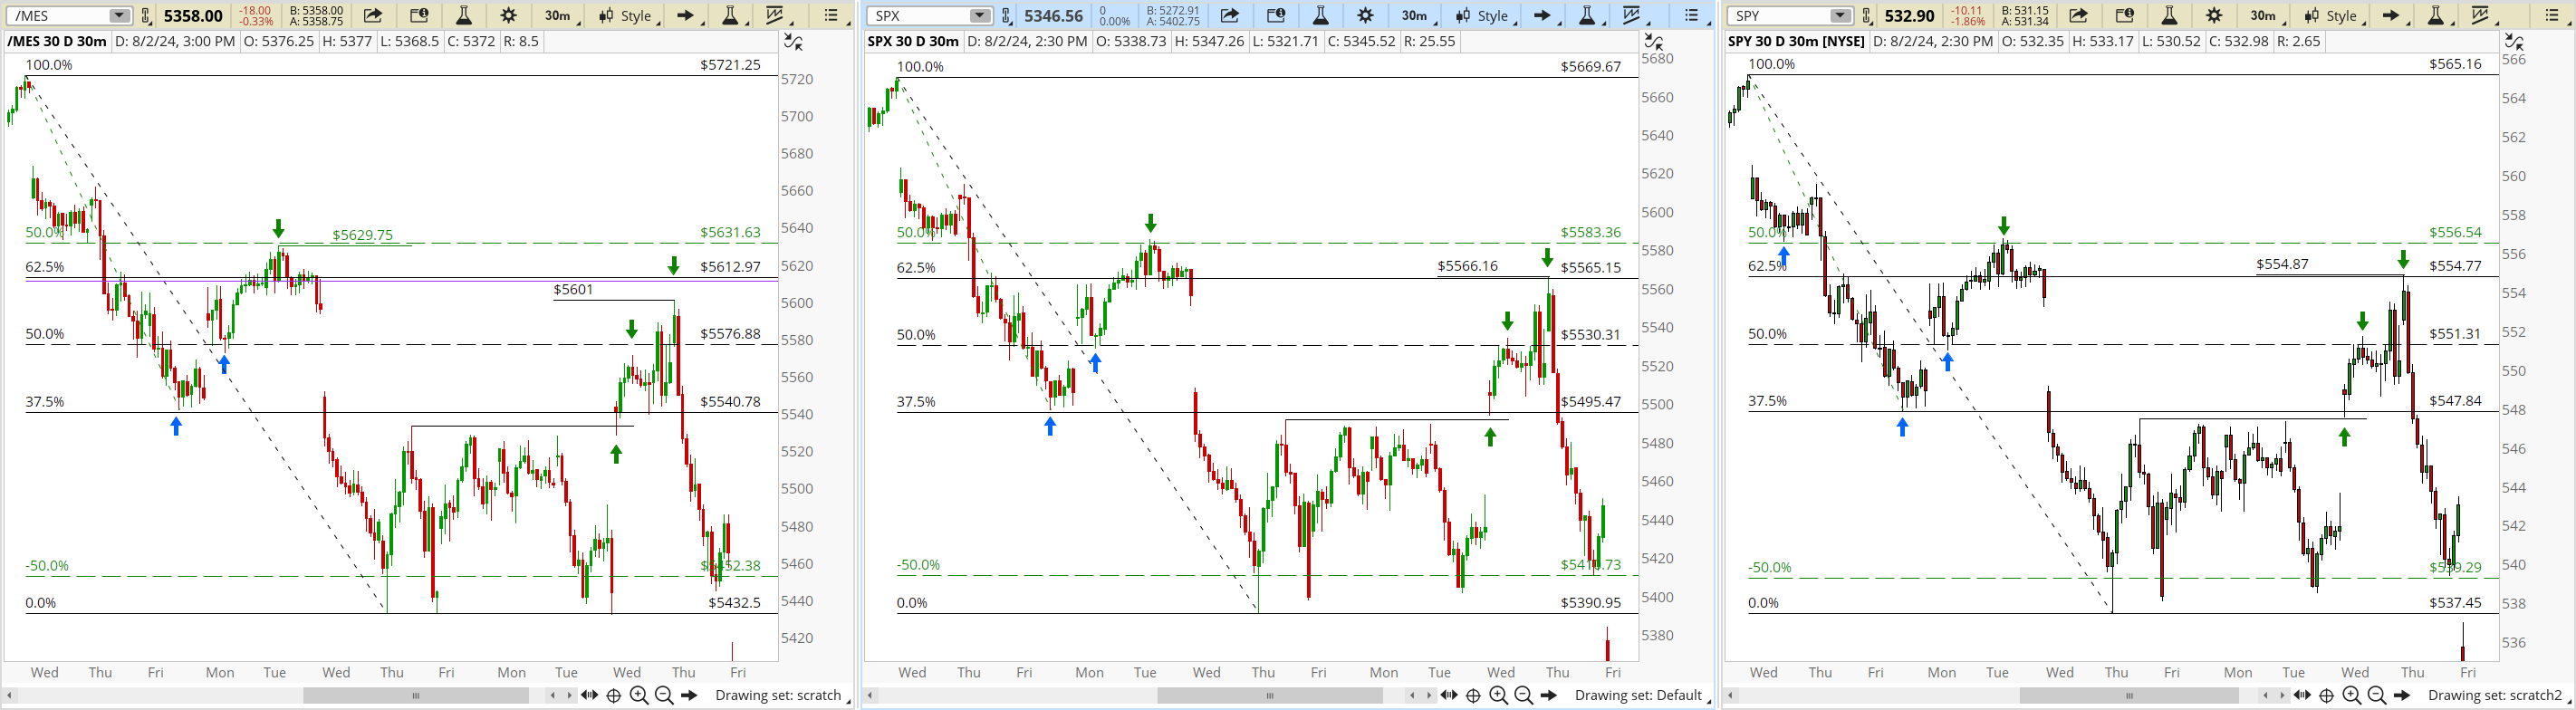
This is a comparison of the S&P index and it's futures and ETF products in the context of Fibonacci retracement drawings.
The green fib is plotted on the 1st leg down and the only curves shown are the 50% and -50% to illustrate an entry and exit. The black fib is plotted across both of the first 2 legs down and shows the anchoring curves as well as the 50% and 62.5% pullback entries and the 37.5%. The 61.8% is the purple line for the benefit of Fibonacci Absolutists who would only have had to suffer a slightly higher MAE if they went short at the Golden Pullback.
The only S&P trade I took in all of this was to buy puts when the SPY first tested the black 50% PB. I was out within the hour due to the FOMC approaching and it was nothing to brag about. The next day, I thought I might try to fade the FOMC and for no particular reason, I would use futures and see if the test of the 62.5% pullback brought any sellers. My plan left me trapped out due to product selection. The SPY bears caught a beautiful PB at the 62.5% while futures bears would have had to get 12 points in front of the market to get in. That's way beyond my 2 tick limit rule for getting in front of entry targets.
I see that everything is more-or-less aligned during the 1st leg down and right after it reversed (blue arrows). Then, the futures bears got trapped out at the 50% PB, while index and ETF bears saw a nice entry (first green arrow). Thereafter, the futures look increasingly heavy - relative to the index and the ETF. Ironically, futures bulls got a nice BOPB on the 2nd reversal while index and ETF bulls got trapped out. Futures bulls that bought the PB at the 37.5% saw a 12 point MAE (14 point MAE for the Absolutists). There is a gap-closure test at the end of the 2nd leg up and futures bears would only have had to endure a respectable 2 point MAE if they're using the RTH close to identify the top of the gap. During this time period, futures traders have a disadvantage if they're using the measured move category of drawings, despite being correct on direction.
I would expect no more than a 1 point decay of carrying costs over this time period. Am I out of touch with carrying costs in the higher rate environment, or some FOMC effect? Any advice on product choice would be appreciated.
MES_SPY_SPX_240802_comp_fib
|


