Welcome to NexusFi: the best trading community on the planet, with over 150,000 members Sign Up Now for Free
Genuine reviews from real traders, not fake reviews from stealth vendors
Quality education from leading professional traders
We are a friendly, helpful, and positive community
We do not tolerate rude behavior, trolling, or vendors advertising in posts
We are here to help, just let us know what you need
You'll need to register in order to view the content of the threads and start contributing to our community. It's free for basic access, or support us by becoming an Elite Member -- see if you qualify for a discount below.
-- Big Mike, Site Administrator
(If you already have an account, login at the top of the page)
So far im down 15 ticks and have only made a few mistakes.
For example Tuesday was a good downtrend day. But it was so choppy and the orderflow wasnt easy to capitalise on for me, even though I had a short bias and took shorts I couldnt get a good impulse going on my entries and so cut my size on winners faster than I shouldve done.
Can you help answer these questions from other members on NexusFi?
can someone post non NT ETH/RTH daily chart of CL to show the back adjustment from the first of the year? NT looks like we are in the middle of the Feb range and TOS shows us not even close to the Feb highs..
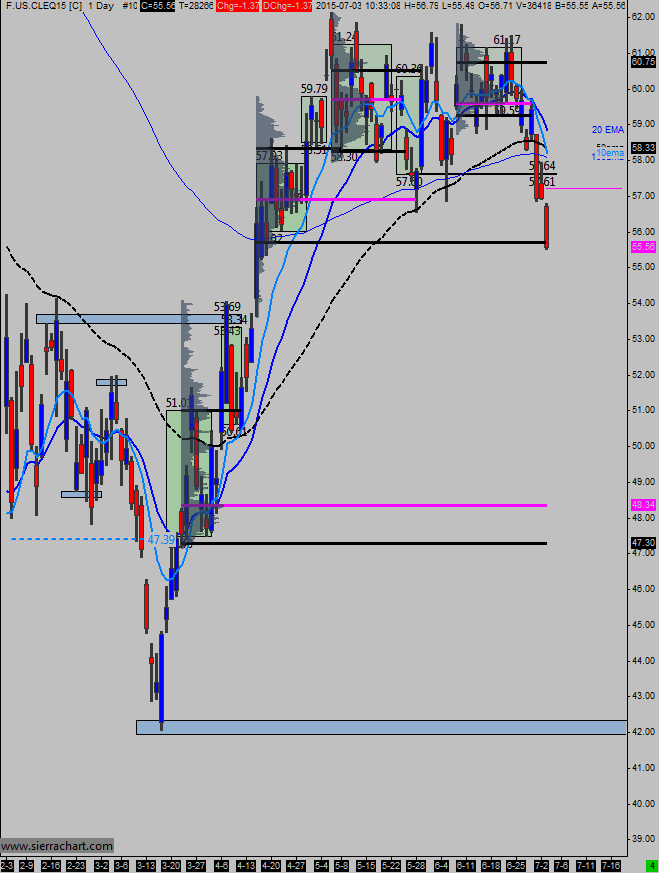
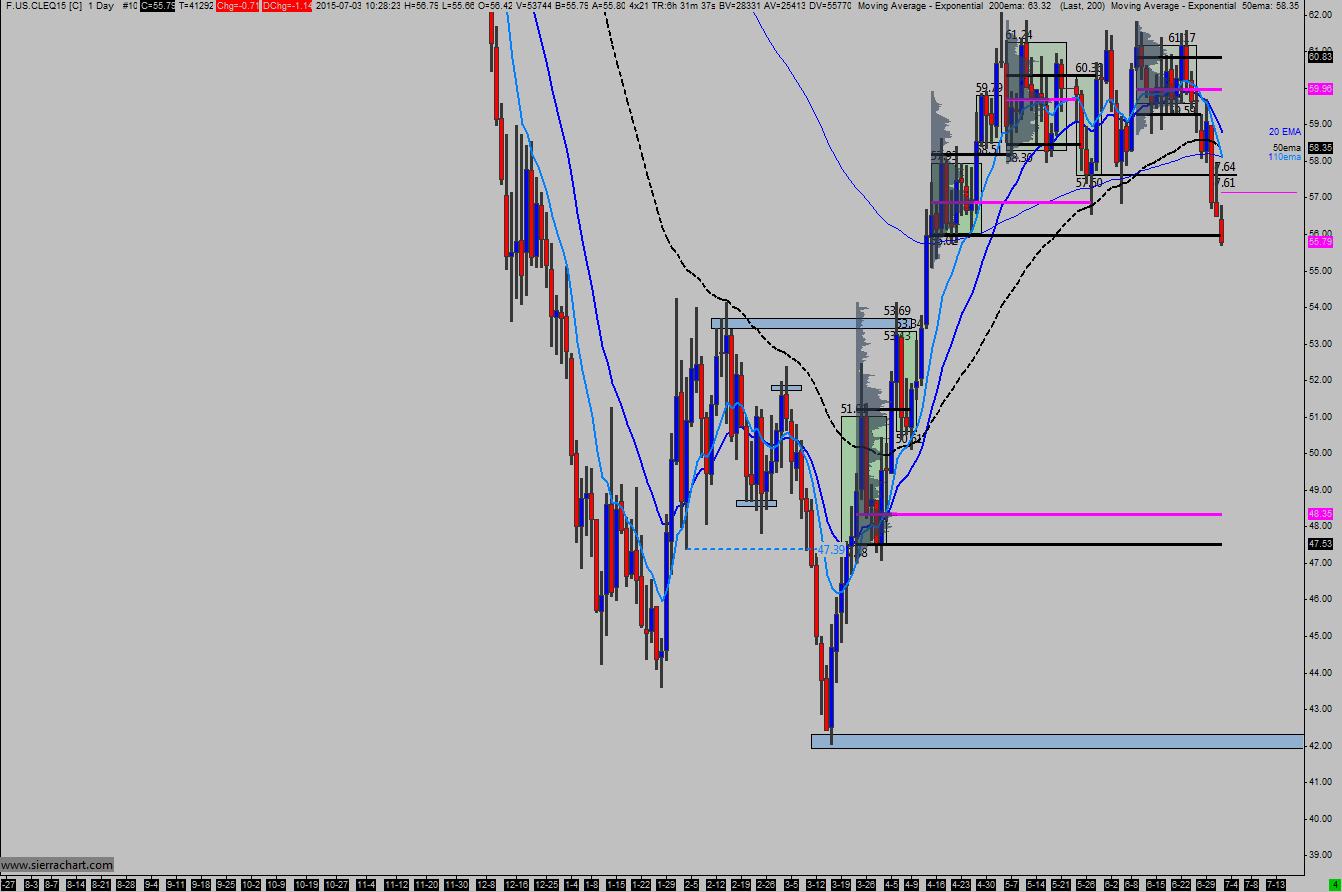
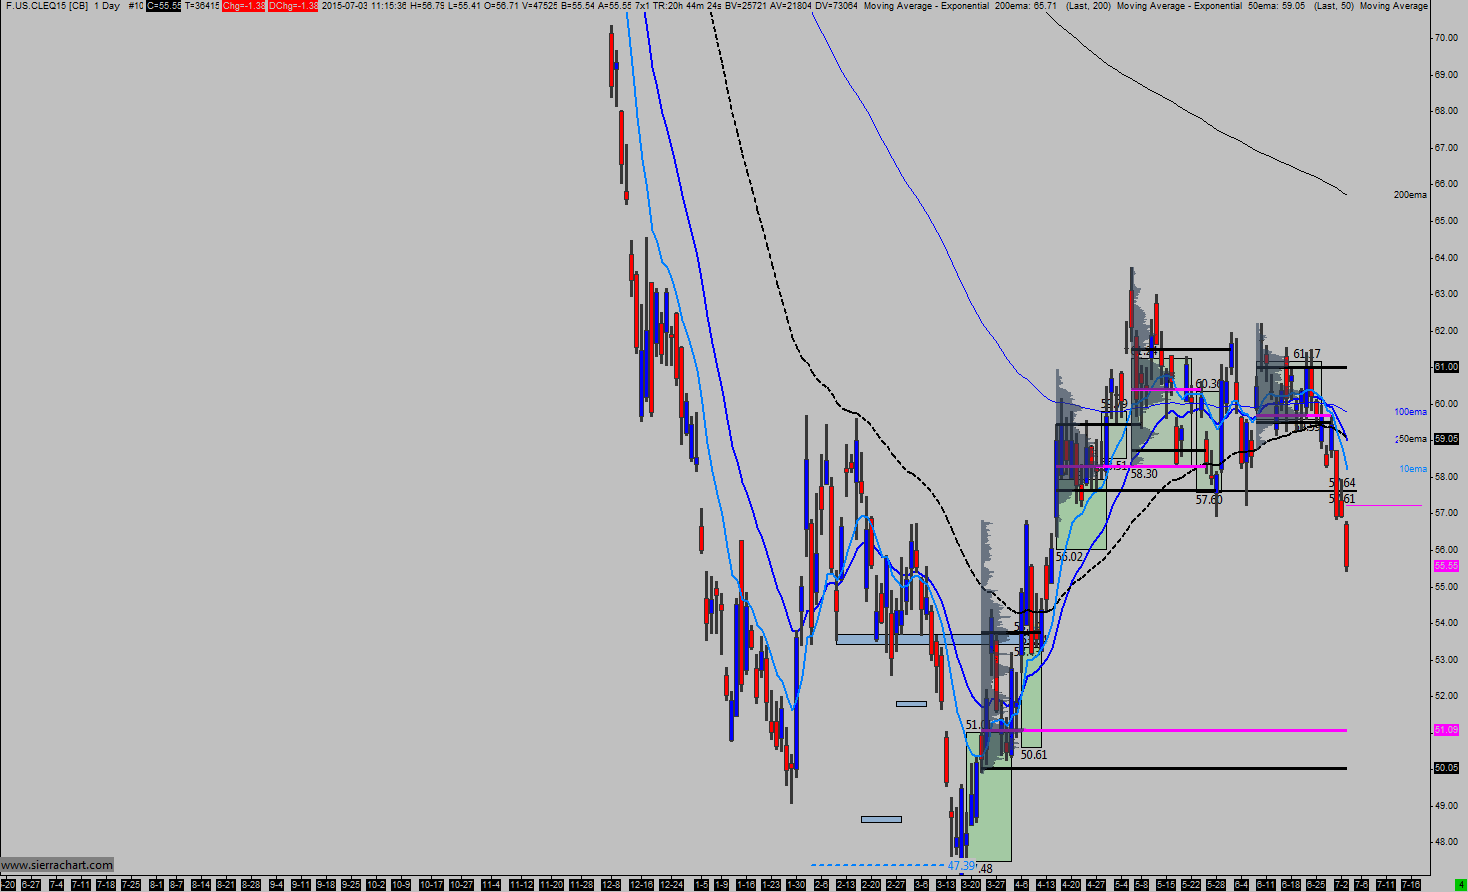
the two above charts are volume rolled in SC. the chart below is date rolled which is closer to what NT shows:
here is T4:
im just wondering what the 'truth' is.. the CME website now uses tradingview for charting and they still have the old charts for RTH which show them more like NT where we are in the middle of the Feb range.
dont believe anything you hear and only half of what you see
NT looks to be correct. The back adjusted (volume based rollover) contract puts the highs made in Feb to be around 59.40-59.70. I have 2/3 high at 59.68, 2/9 high at 59.43 and 2/17 high at 59.59. The monthly low was on 2/2 at 52.11.
there are no dates that i know of. volume just rolls over when there is more volume on the next contract than the current one. the actual roll dates are probably the closest thing you will get to a date for prediction.
dont believe anything you hear and only half of what you see
No, sorry, I'm slicing together a Cl continuous contract and I was wondering if anyone had a list of past dates for when contract rollover was, based upon volume.
I'm interested in finding or making a list of dates where there was more volume on the next contract than the previous one. (volume based rollover)
ah sorry. i know some platforms you can roll contracts specifically on volume so maybe you can have it print on a chart when that happened in the past. im not sure.
dont believe anything you hear and only half of what you see
I got the seperate CL contract data from CME and pasted together a continuous contract chart (non-adjusted) using Open Interest as the day to switch to the new contract. Volume just doesn't cut it as it signifies a switch only 2 days before expiry whereas Open Interest signifies a switch about 9 days before expiry. It looks nice and possibly could be used by big money.
It's telling me the recent plunge (current: $55.52 7/3/2015) will hopefully bounce next week off a line at:
Monday: $53.43
or
Tuesday: $53.32
or
Wednesday: $53.21
or
Thursday: $53.10
or
Friday: $52.99
Let's see what happens!
I don't have access to futures so I trade Oil ETFs like UWTI and DWTI with extended hour access.


 dont believe anything you hear and only half of what you see