Posts: 257 since Jul 2014
|
Screenshot 2023-11-03 at 04.41.31
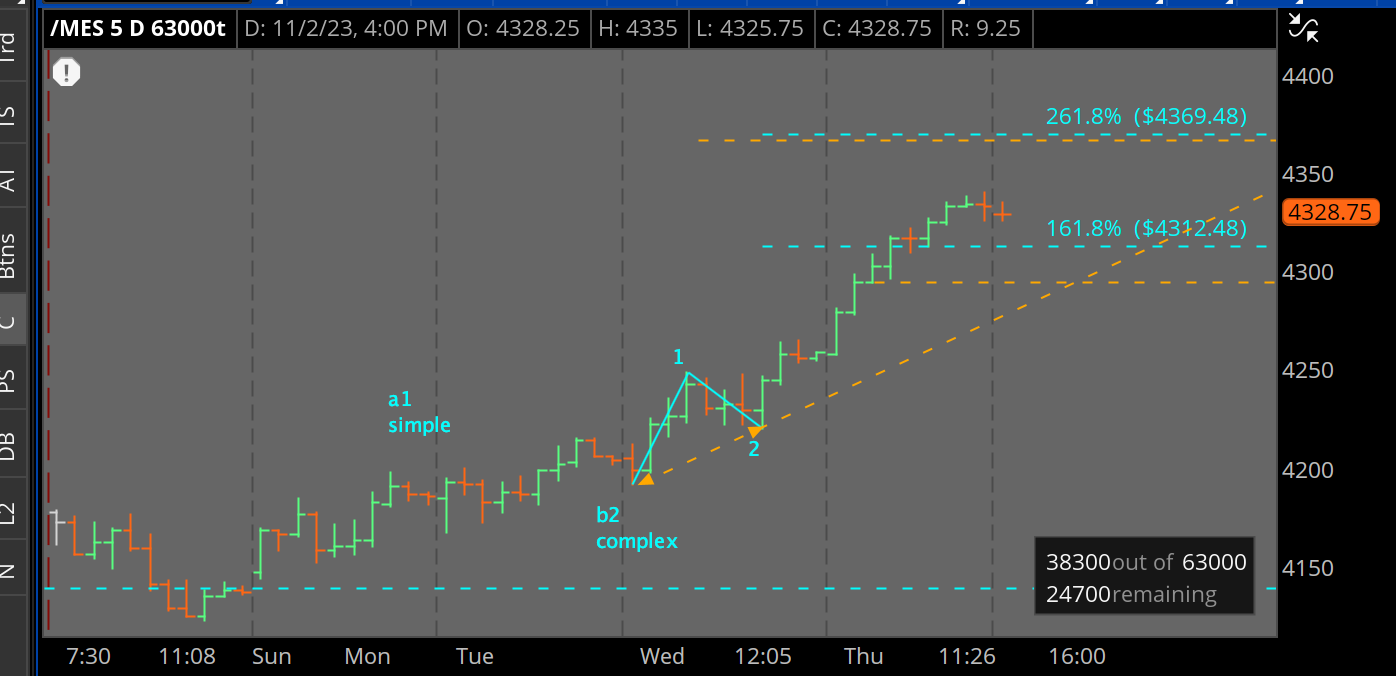
1.618 has been crossed. A rule I have and I have a hard time getting placed solid in my mind. On this chart the market exceeded 1.618 and often will correct some at this point before going higher. The gap up overnight is a support line.
Every market ends in an impulsive wave, for even a C wave is an impulsive wave. A line from wave 1 beginning to wave 2 ending into the future that wave 4 will touch or pentrate before wave five ends. Whether it ends higher or fail is unknown. At least I have not found any reliable way to predict except by future support or resistant areas on a chart. If wave five fails the market most often ends right at 1.618. as the highest point.
If not, one has to count the fifth wave for failure at 1.618 and that may also. correlate with 261.8.
The horizontal line is support from the gap overnight trading created.
261.8 is not something I have studied and think I will start researching how it may have a role in trading. The market can correct some here before going higher since it did not end on 1.618 has been a SoonPeso7 rule.
|


