Welcome to NexusFi: the best trading community on the planet, with over 150,000 members Sign Up Now for Free
Genuine reviews from real traders, not fake reviews from stealth vendors
Quality education from leading professional traders
We are a friendly, helpful, and positive community
We do not tolerate rude behavior, trolling, or vendors advertising in posts
We are here to help, just let us know what you need
You'll need to register in order to view the content of the threads and start contributing to our community. It's free for basic access, or support us by becoming an Elite Member -- see if you qualify for a discount below.
-- Big Mike, Site Administrator
(If you already have an account, login at the top of the page)
Thanks for the quick reply and your answer is helpful and got me *most* of the way there.
Why doesn't my chart display the information at the top of the swing at 15:30? And how can I delete the HL/LL type indicators? I've tried every which way but I only want tick change and absolute volume.
Perfect. Thanks so much! One last question....is there any way to have the "volume per tick" calculated automatically for these swings, or does anyone do something similar another way?
I'm afraid I don't think that's possible. it can certainly be programmed. but is such an information really helpful? if you load a 1 tick chart you can see for yourself:
I am trying my hardest not to be dense here, but I don't see any volume on that chart?
I've seen data like this in real time, on a depth of market (for individual levels). On a swing chart it would give you (at a glance) the volume relative to the size of the swing, not just a gross figure.
now I'm a little lost. these days the volume per tick is very low. you'll see a lot of 1 or 2 contracts. even if there're 500 contract traded at that level, it most certainly will be reported in smaller quantities.
If you are lost that's my fault for sure. I'm new to this subject and although I'm trying to be precise, I'm being precise in an incorrect way. I might even not understand correctly what is happening with my chart or the PAS indicator.
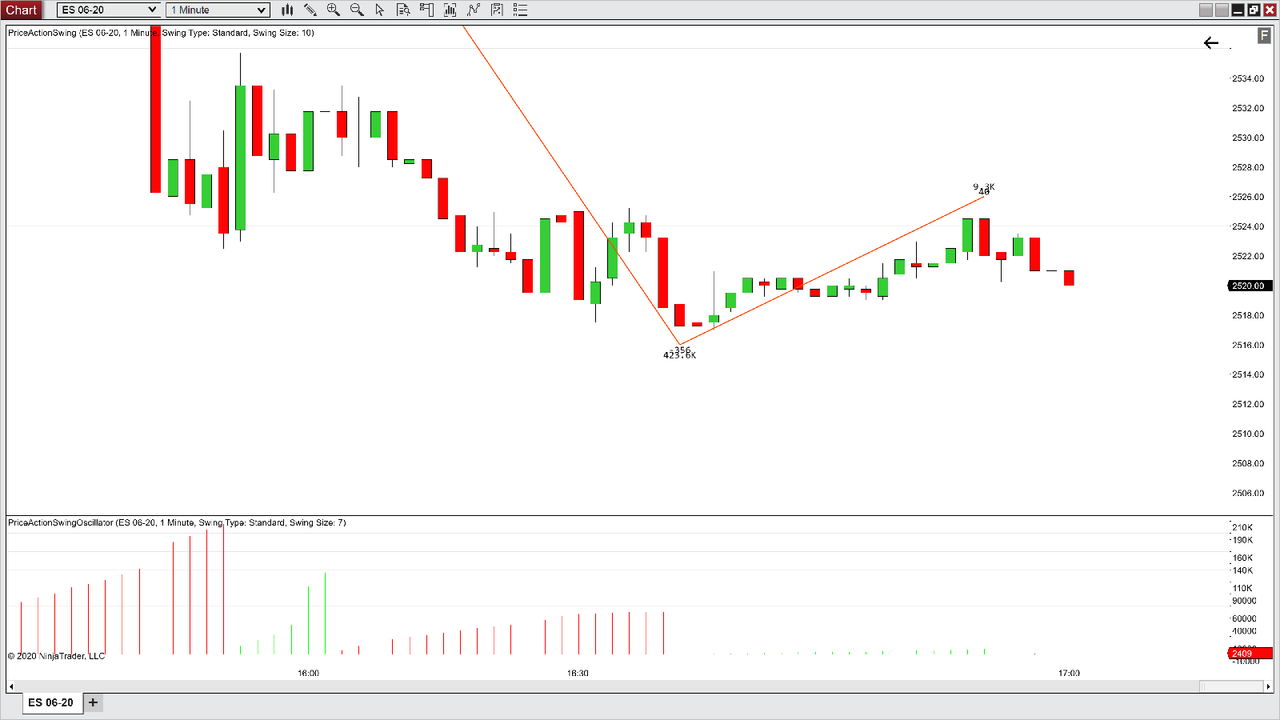
The data I would want would look at the last swing. It was 40 ticks up, and there was 9,300 contracts traded on that swing. There would be a value of 232 printed on the chart representing 232 contracts/ tick price increase on that swing. It's a value I was interested in the first time I saw a swing chart.
no, you're fine. I do now understand. what you're looking for requires a change of the code. you would change the relative volume calculations by dividing the swing volume with the length (how many ticks)
then the "new relative volume" would look like this: