Welcome to NexusFi: the best trading community on the planet, with over 150,000 members Sign Up Now for Free
Genuine reviews from real traders, not fake reviews from stealth vendors
Quality education from leading professional traders
We are a friendly, helpful, and positive community
We do not tolerate rude behavior, trolling, or vendors advertising in posts
We are here to help, just let us know what you need
You'll need to register in order to view the content of the threads and start contributing to our community. It's free for basic access, or support us by becoming an Elite Member -- see if you qualify for a discount below.
-- Big Mike, Site Administrator
(If you already have an account, login at the top of the page)
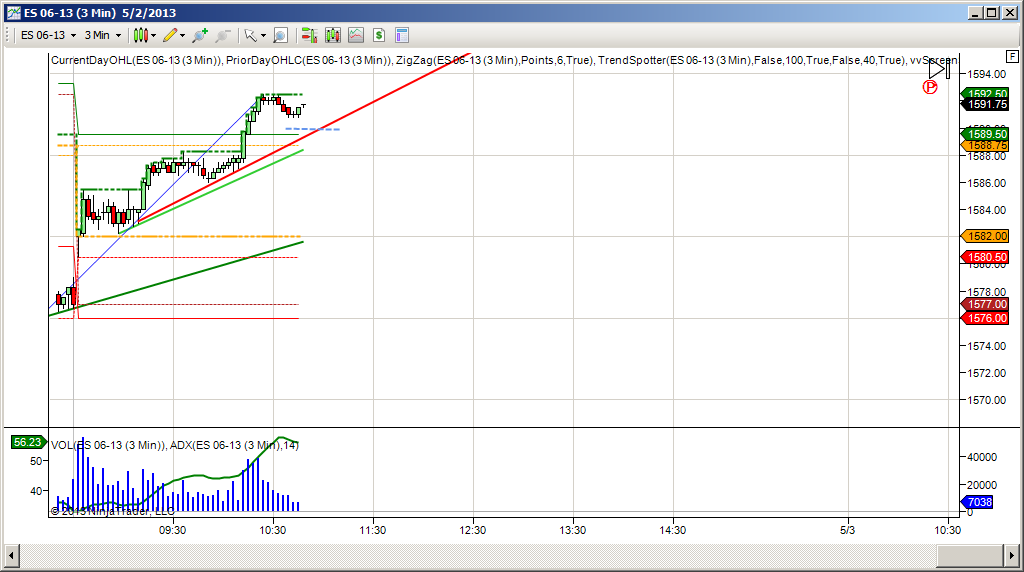
Finding S/r level and drawing trendlines properly the most important thing to learn. It is also skipped over by too many traders.
Start with the larger time frame and work down.
For downtrend lines connect the tops.
For uptrend lines connect the bottoms.
Divide important moves into 8ths (and thirds) to look for possible S/R levels.
One of the basics in becoming a good trader is experimentation.
The traditional tools I'm showcasing here have been tried and tested over time and so you must have these in your toolkit.
Some may have been thinking "You're showing us these fundamentals, so what works?"
In the age of rapid spreading of ideas what works best (for you) is a system that fits your personality (and time and resources and goals). Additionally you must bring some originality to your profession to truly excel at it.
"Keep experimenting - even at 80 I am making new discoveries." - Gann (loose quote)
You need an open mind and you need to follow your intuitive hunches to experiment successfully.
Once you have spend some time working through the compounding of numbers you understand that there are very few who have a set of systems that produce consistent results. (Try 15 points a week over 52 weeks and see what you get).
When you have gone through the exercise you will understand for yourself that reading a book on market profiling will only put you in a sea of competition with hundreds of thousands others. Know that banks and large trading houses have huge pockets and massive computers and a sea of bright MBAs and statisticians. If more of these would give them an edge they would do it. Instead they hack an AP twitter account or fat finger a Thursday or run stops.
To be away from the competition and to give yourself a chance you must think and create something new for yourself.
In making your trading plan you need 3 components
The setup & exit
stops money management.
A setup is a set of conditions that you have decided puts the odds in your favour for a profitable trade.
This will have two components- the amount you can make versus lose (the reward:risk or RR ratio) and the probability of it being profitable.
Different setups will have different RRs and probabilities.
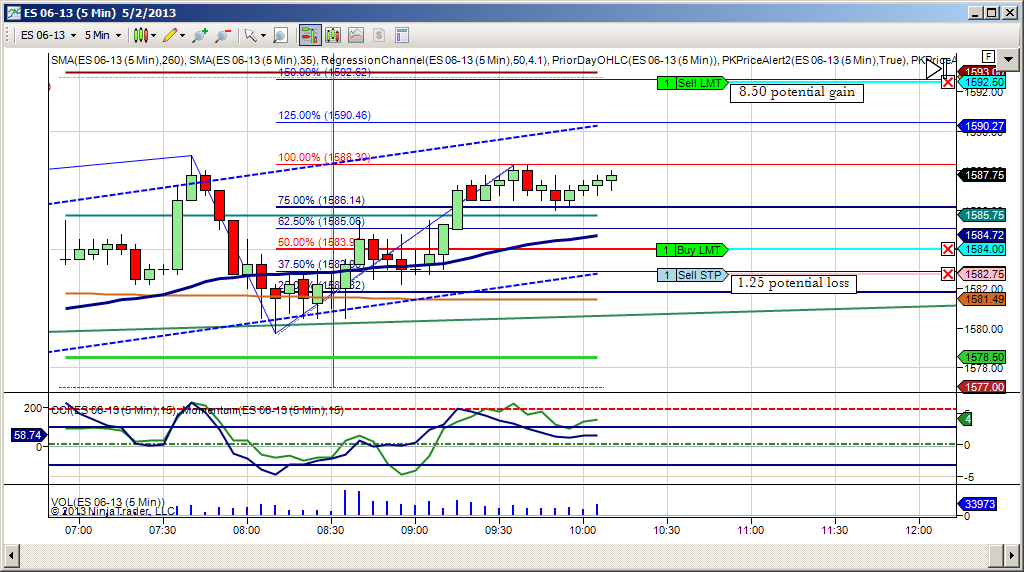
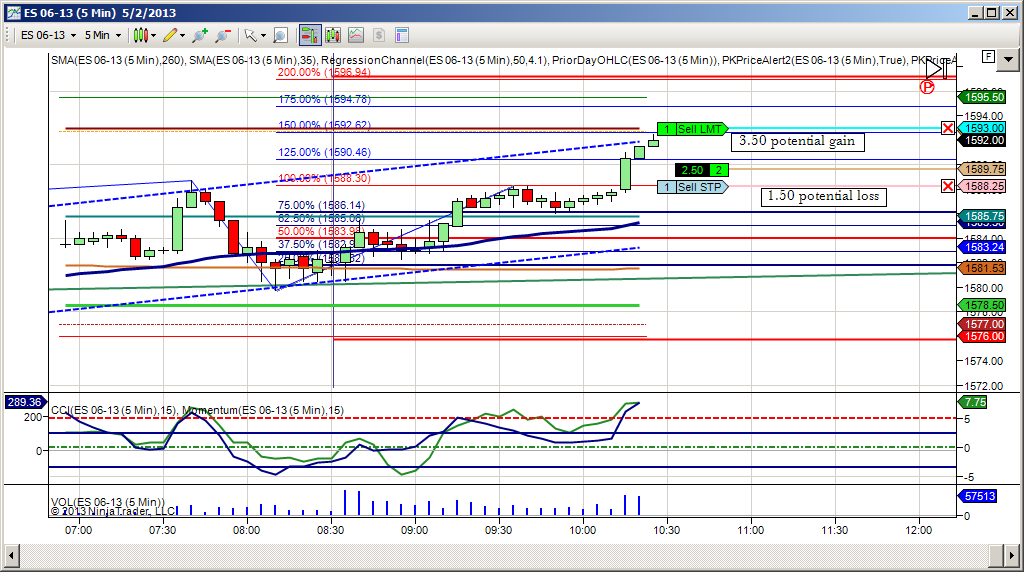
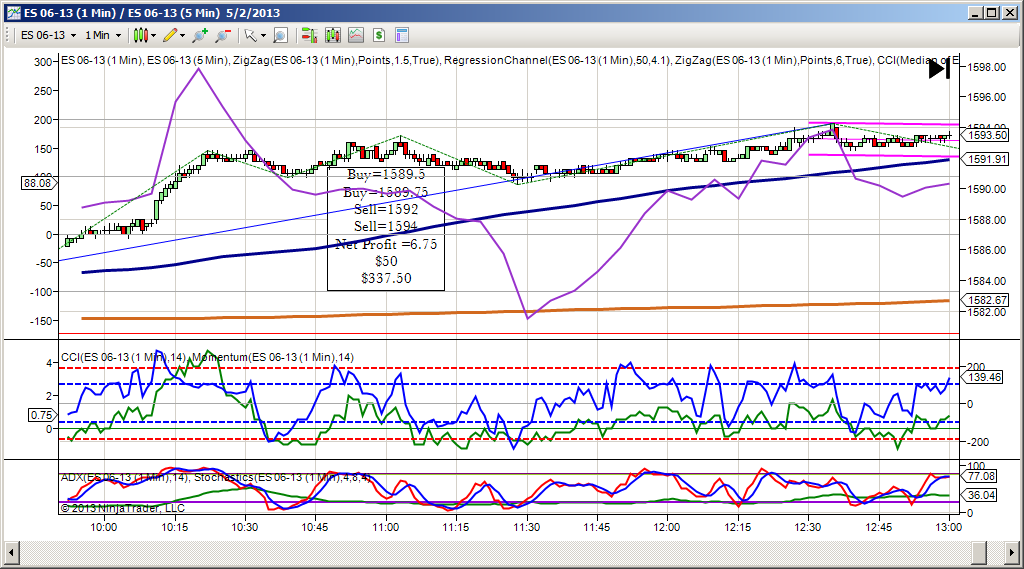
One of the keys in creating a setup is trends and retracements.
Here are two videos using the ES action for today (Wednessay) to look at retracements.
(I'll have to do more on this in a later post)
We have gone in at market as the market pulled away.
This action was suspected (as we mention in the previous post) in part one due to the shallow slope of the lines.
The video shows how we adjust the stop.