Welcome to NexusFi: the best trading community on the planet, with over 150,000 members Sign Up Now for Free
Genuine reviews from real traders, not fake reviews from stealth vendors
Quality education from leading professional traders
We are a friendly, helpful, and positive community
We do not tolerate rude behavior, trolling, or vendors advertising in posts
We are here to help, just let us know what you need
You'll need to register in order to view the content of the threads and start contributing to our community. It's free for basic access, or support us by becoming an Elite Member -- see if you qualify for a discount below.
-- Big Mike, Site Administrator
(If you already have an account, login at the top of the page)
The only thing you can do is to backtest a setup, then calculate
- the average winning trade
- the average losing trade
- the winning percentage
From these you can calculate an expectancy for each trade, which describes the past.
This is the point where it gets difficult. Any approach that has been profitable in the past, will not necessarily be profitable in future. Market conditions change, technology modifies the market place, the behavior of market participants may be different.
To increase the probability that the backtested results are applicable to the future you will now conduct
- a walk forward analysis
- and a Monte Carlo simulation
This will give you a new set of expectancies, to compare with the first one. Typically these expectancies are already less favorable.
Armed with positive expecntancies from backtest, walk forward test and Monte Carlo simulation, you may now start to trade.
You trade a probability that your prior calculated probabilities still represent the actual probability. Unfortunately, no probability can be calculated in an explicit way.
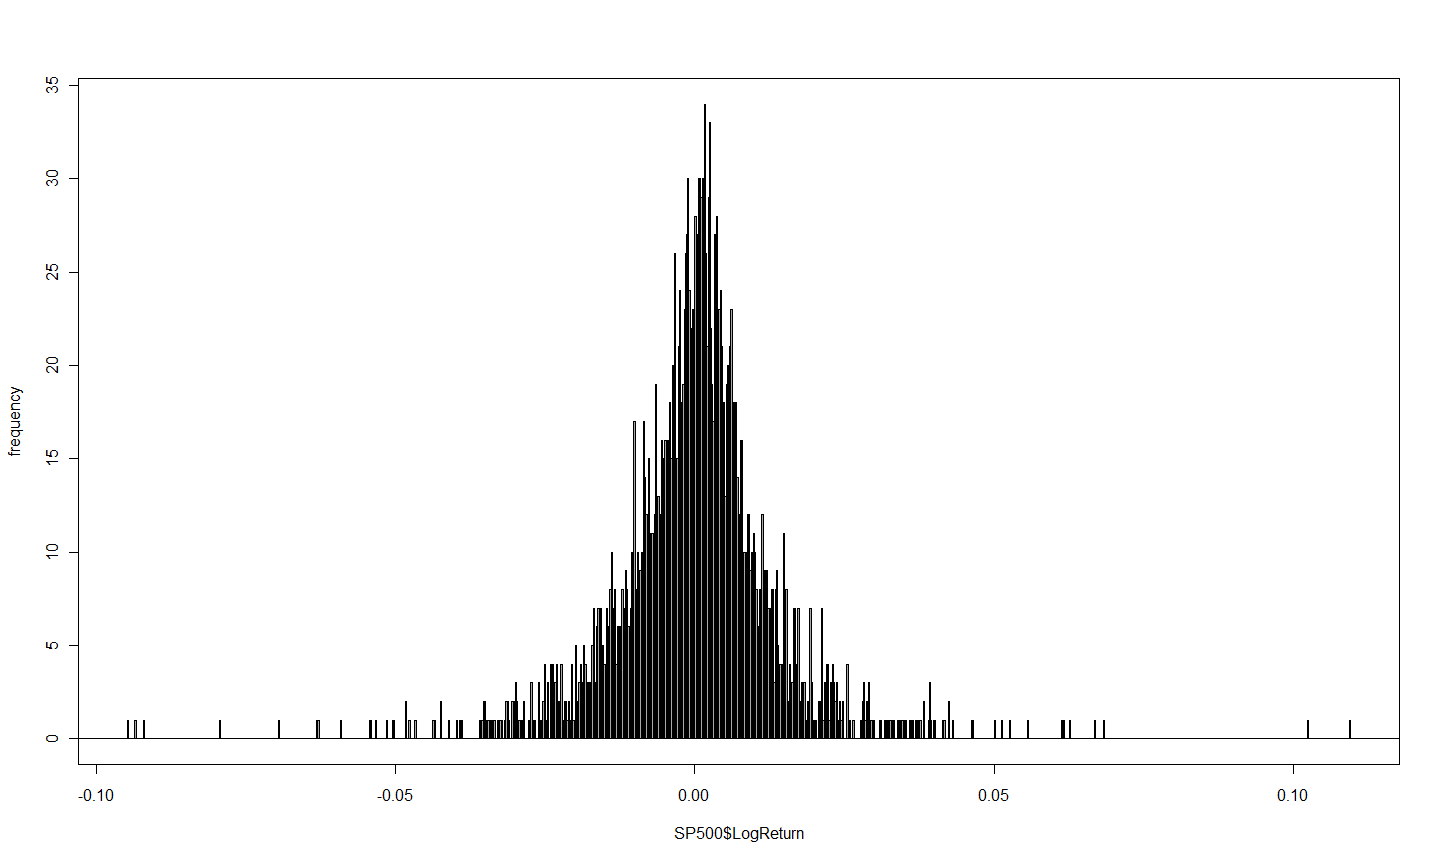
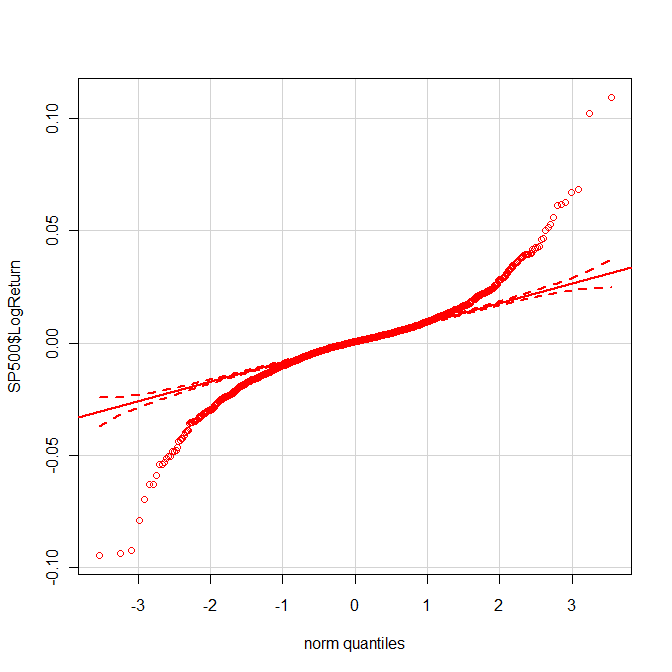
Histogram of the daily log returns of the S&P 500 for the past 10 years, as well as a QQ plot. Created using NT7, the ExportData stratgey, the LogReturns indicator, and R:
Summary Stats:
> summary(SP500)
LogReturn
Min. :-9.470e-02
1st Qu.:-5.695e-03
Median : 6.967e-04
Mean : 1.645e-05
3rd Qu.: 6.051e-03
Max. : 1.096e-01
The mean and median are positive, which is good if you are long.
But the Fat Tails can hurt
On a serious note I take issue with serial dependency for GBM, random coin tosses, etc. The coin doesn't care if it has flipped heads 20 times in a row. It's a 50/50 shot whether the next flip will be heads or tails.
Markets, however, might care if they are up 20 days in a row because they are not 100% random.
Figuring out the part that is not 100% random is what makes you money.
Nice chart, shows the fat tails very well. Maybe I should play around a little with R. I have never used it so far.
The median is greater than the mean. This confirms that the stock market is slightly asymmetrical. There are more days with positive returns, hence the greater median, and fewer days with negative returns, but those days can bite, as showed by the lower mean.
I would expect that for most of the commodities you will find a greater mean than median, which is the opposite to what you got for the stock market.
I agree that it is very difficult to exploit the few outliers, although trend followers can catch some of them if they are sufficiently patient. However it is psychologically difficult to endure many small losses, before reaping a large reward once and then.
Fat Tails R is worth checking out. Its free, the community is growing, and there are some great packages for it. There is a learning curve, but that is OK as you don't have pay for it every time there is upgrade. Time is on your side.
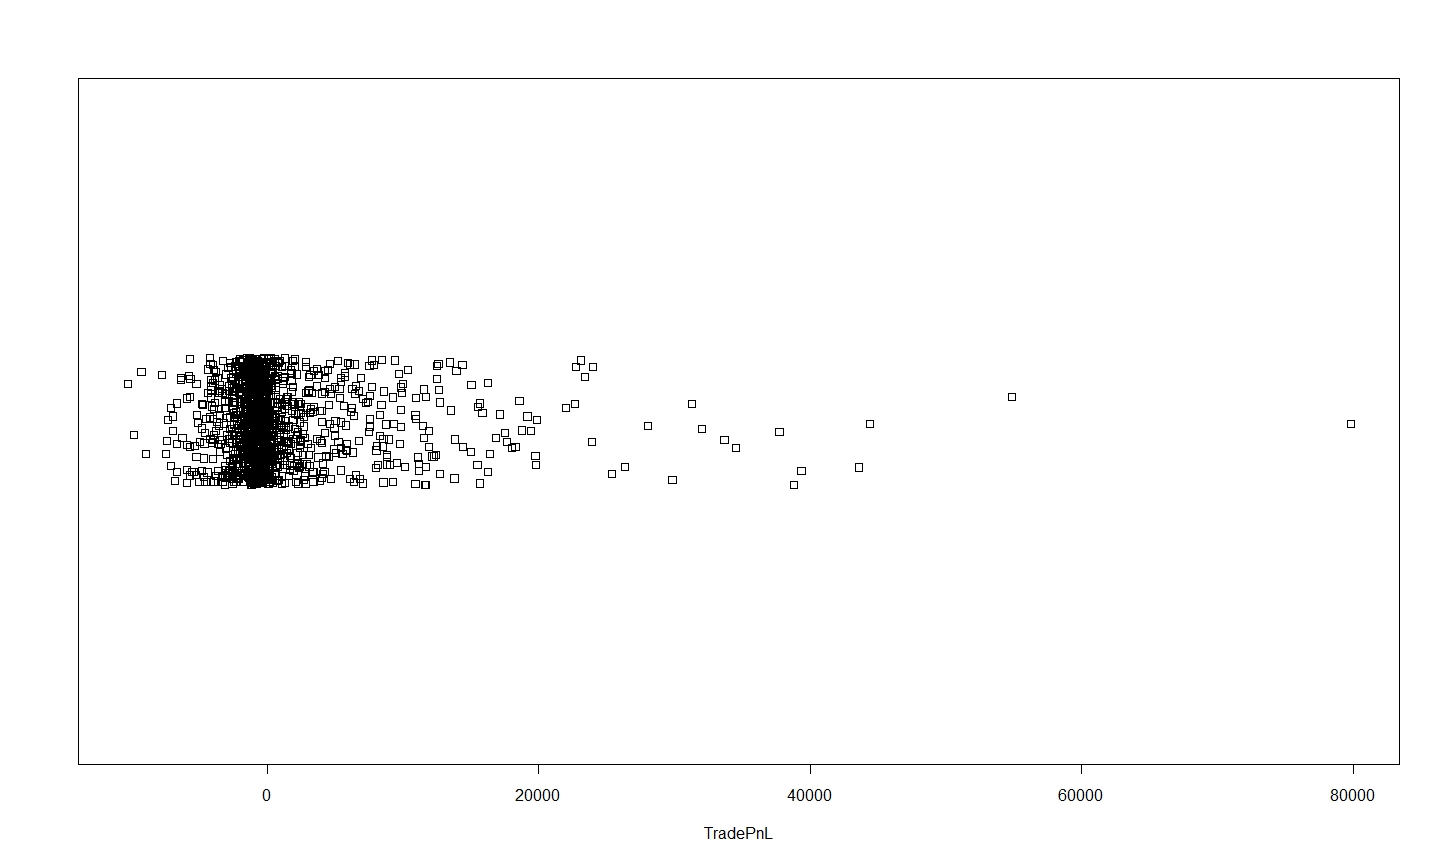
Here is another NT ExportData/R graphic. In this case exactly showing how its (theoretically) possible to exploit the "Fat Tails" on the right side of the distribution. That's another way of saying "cut your losses and let your winners run" .