Welcome to NexusFi: the best trading community on the planet, with over 150,000 members Sign Up Now for Free
Genuine reviews from real traders, not fake reviews from stealth vendors
Quality education from leading professional traders
We are a friendly, helpful, and positive community
We do not tolerate rude behavior, trolling, or vendors advertising in posts
We are here to help, just let us know what you need
You'll need to register in order to view the content of the threads and start contributing to our community. It's free for basic access, or support us by becoming an Elite Member -- see if you qualify for a discount below.
-- Big Mike, Site Administrator
(If you already have an account, login at the top of the page)
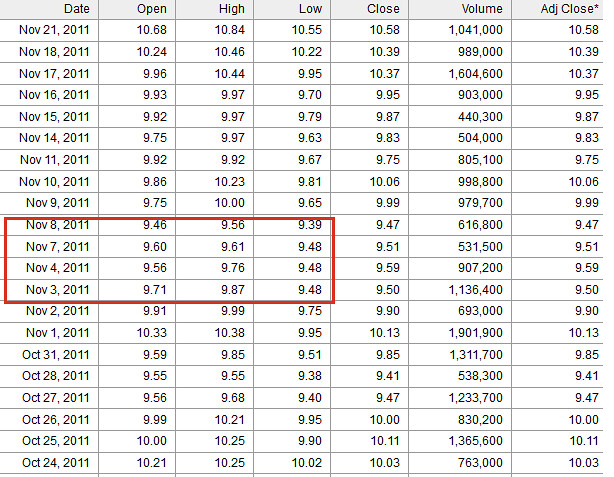
You are up from about $9.40 (nov 8th) to the current price ($10.60) so
+$1.20 on $9.40.
This is +17% in 10 trading days.
Next time you hear a wise-cracker say that chart reading doesn't work, you will know that they don't know what they are talking about. (though like any skill an boomkoof can make a muck of it.)
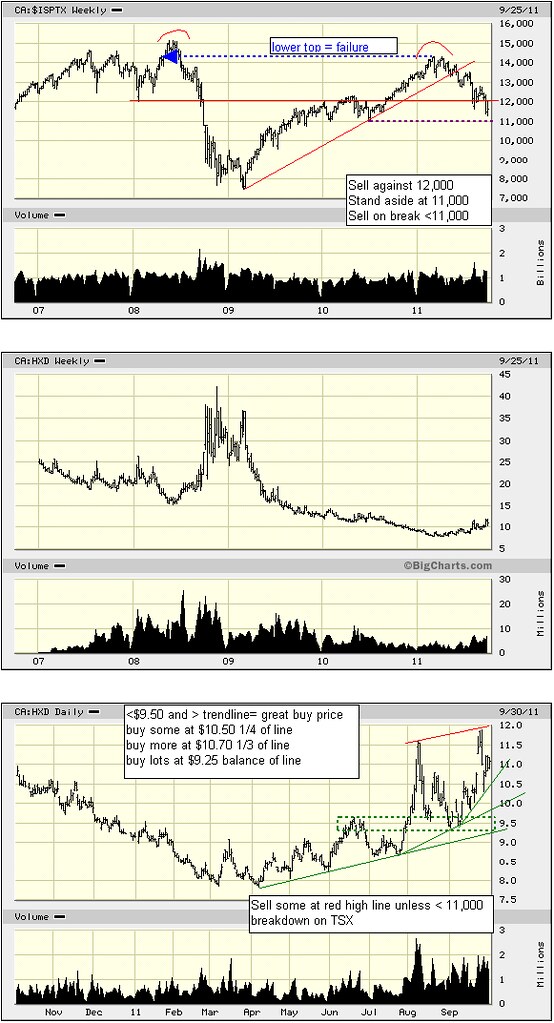
The target given earlier was:
"the high red line"
which is in the +$12.50 area now.
The central banks got together to provide USD lending to european banks as an emergency move which some say was motivated by the potential collapse of a French bank.
There was a large jump in the markets - no doubt aided my US govt buying to rig the markets.
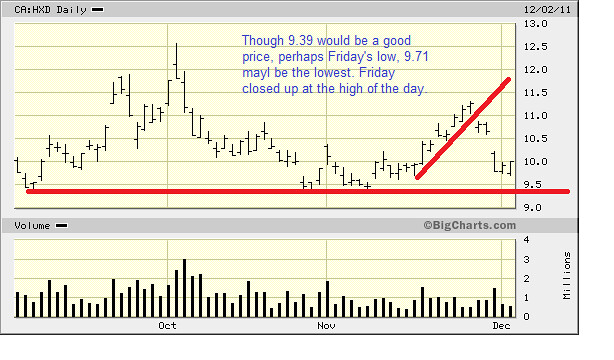
This provides a good price for buying HXD.to (HXD moves inversely to the TSX). Friday's low of $9.71
$9.39 would be the best price it would be the the fourth(?) test of the low and may well fail. It's a bit dicey going in at this point with so much market manipulation going on.
On the side of a buy is the gap in last week's chart 10.59 to 10.22 so closing the gap favors a move to 10.59.
If going long on Monday in the 9.71 area you could sell some on 10.59 (which could happen by Wednesday).
sounds like a good way to ensure protective stops have no protective value in a fast market.
Good to know that IB feels it is important for clients to take the role of market makers and provide the liquidity and "fair and orderly market".
So Monday's low was 9.66 or 5 cents below the low of $9.71 of Friday.
Tuesday's high was $10.15 or +49 cents. (Sell Day)
Today's range was $10.19 to $9.84 (Sell short Day) with rise to 10.19 from 9.66 = +53 cents.
This gives a Buy day target for tomorrow Thursday in the $9.80 area see green circle.
So today it did go down into the green circle the objective area.
The objective was meet in the morning which is what you want for a buy day.
FE=LE (first end = low end).
The low was 9.92 in RTH for HXD.
(An even better trade was about 7:30 - if you were trading ES.
For the ES you would be shorting as the HXD is the inverse of the market.)
The last "rally" (buy day low to sell day high), so our objective for a sell target tommorrow is 10.41.
-see calc in picture.
In ES terms we had and RTH high (FE=HE) of 1256.25 and a fall of 25.25
(On Monday 5 Dec -3 days ago it was (FE=HE) of 1266.25 and a fall of 22.50)
In The Taylor trading system there is a 3 day cycle.
Today was the short sell day for the HXD (I have shortened that to "short" on the graph)
On Thursday we had a buy day with a low of 9.92
Today, Monday, we had a high of $10.47.
The difference is 0.55 or +$550 on 1,000 shares.
Tomorrow is a buy day. So you are looking to buy (and you would like the buy objective to be met first).
So you want the FE=LE. I have computed the decline for 1 day and for two days with an average of a -$0.25 decline.
Using $10.47 we have estimates of tomorrows low at $10.20 to $10.24
Graphically the estimate is the blue circle.
With the decline of the spx so sharp (and the rise of the HXD so sharply up - with a gap today), my feeling is that the resistence levels of 10.13 and 10.19 will not be tested and it is the higher 10.20 to 10.24 that you will have to pay.


 sounds like a good way to ensure protective stops have no protective value in a fast market.