Welcome to NexusFi: the best trading community on the planet, with over 150,000 members Sign Up Now for Free
Genuine reviews from real traders, not fake reviews from stealth vendors
Quality education from leading professional traders
We are a friendly, helpful, and positive community
We do not tolerate rude behavior, trolling, or vendors advertising in posts
We are here to help, just let us know what you need
You'll need to register in order to view the content of the threads and start contributing to our community. It's free for basic access, or support us by becoming an Elite Member -- see if you qualify for a discount below.
-- Big Mike, Site Administrator
(If you already have an account, login at the top of the page)
DCB - very interesting post. What you wrote in your post is what I've been studying for the past several months.
Can you explain what you mean by daily & weekly pivots? Are you talking about the mathematical calculated pivots from OHLC or are you talking about eyeballing a chart and determining the pivot points where price has turned?
"Gathering points to take the bus together." Bingo Fat Tails! Well said. Just because we see really long tails/wicks on certain bars with massive volume does not necessarily mean the professionals are done accumulating or distributing. We must also look at the levels they are trading off of to determine what their intentions are. When we see them buying or selling the hell out of the market, we have to wait and see if they want to buy or sell more. In my experience, in order for them to get everyone on the "bus" they usually go even lower or even higher after we see the first sign of them being active. I deem these as little mini buying and selling/shorting campaigns. After they are done, its just a matter of time before they push the market in the direction they want in order to start peeling off their cars little by little for profit.
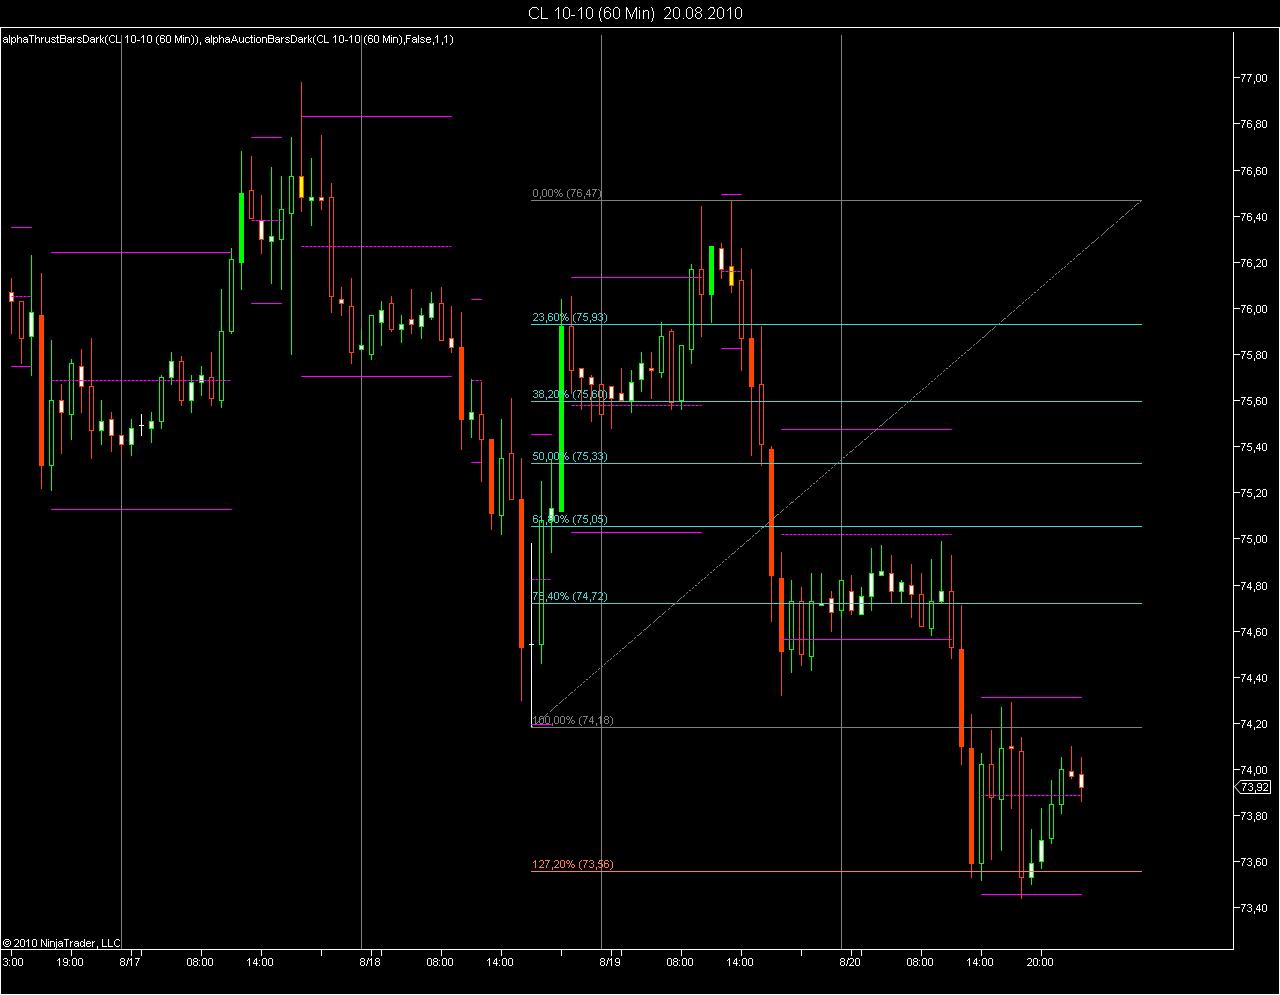
As for your chart, please, if you would, tell me where you have your high and low for your Fib level? I need to see it on my own chart to find the 73.55 level you speak of.
How exactly does time play a role with MP? Please educate me as best as you can how a time variable is necessary to determine future price related to volume.
With respect to tape reading, I too am far from being a self proclaimed master, but in the many years I've been reading the tape I will say that I'm vastly a different trader today than I was, say 5 years ago. There's different variations of the vague term "tape reading." Not all tape readers in this highly technological, contemporary market place all read the tape the same way. However, when you look at T&S, just remember for every row that you see red denoting size and price of that "sell" there's also a hidden green that most retail trader's minds don't process. There's a buyer on the other side of all of those red T&S's!
You are correct though, it takes time to get good at it. But to look at a chart and try to find where professionals are buying and selling isn't too difficult. And once you can recognize where they are, you can then begin to practice a method on how to hop on their backs and "take the bus ride" with them. (credit to Fat Tails for the bus analogy).
I am aware that we are hijacking this thread, which is about market profile. Sorry David. If this going too far, one of the moderators could move the posts to a new thread, so for the time being I will answer here.
The level is identified with a 127.2% expansion generated from the swing starting from Wednesday's low and ending on Thursday's high. You also can use the size of the first swing down (Tuesday to Wednesday) to get an idea of the size of the second swing. This would give you a target around 73.66
You mentioned some intraday fibs. Which ones were you referring to?
That's a real good point David. I have yet to get into Fib levels related to this discussion, but I will say that I've seen on many occasions, professional money blowing right through what the market assumed was a clear and obvious Fib level. See the thing is, is that Fib levels are real, but many, many people use them and if they were respected so greatly by smart money they would never be breached. And if they were so strong, then why doesn't everyone make money trading Fib levels. Lets face it, to use Fib levels is not rocket science, but it is the intention of professional money to use tools like Fib levels as a way to, if you will, cloak their intentions and fool the masses. So they may work here and there depending on time and what someone is willing to take for profit from trading off of them, but in the grand scheme of things, Fib levels, for the short term trader can assist in handing your ass to you.
This industry has flooded the retails traders with a massive tool box of all these neat little gadgets to try and coax the smart people out there in pixie-dust land into thinking that they too are smart enough to use these tools to make money in an environment that technically is rigged.
I see all of these pretty indicators and such simply as marketing tools to draw in more money from the retail side so that the smart money, brokerages, software developers and the exchanges can spread this new retail money around. It's like going to the bank to take a withdrawal on an account that you don't own, but in their case its legal. I can go on and on about how this industry is brutally unfair to the retail schlep and how everything is specifically designed to take money from the hands of this mass of misinformed people. Remember, without the misinformed everything changes and smart money would only be able to feed off of themselves. Since that's not reasonable in their minds, they rely on the inherent nature of human beings to jump on the prospect of being able to make a fortune by clicking a mouse.
Nicely perceived David. A couple of things. #1) I'm not sure if price varies all that much since we just flipped to the October contract but I began trading it on 8/19 (CLV0). I don't use the continuous contract. #2) IMO, you did a very good job in a VSA manner to break down those bars, however, there's much more to the story. #3) Sure its easier to see it all in retrospect, but doing it on the fly can be done without having to take on too much heat. I happen to do it every day. In fact Friday was far and away my most profitable day in August. However, the vast majority of my gains on Friday were on the drop leading up to the lows of the session. Then I took a small-lot pop to the upside as we neared the end of the open outcry. #4) There's more to your chart from my perspective than you have denoted David. Meaning that there's alot of missing levels. I don't expect that you would be able to draw a chart the way I do, but I have 7 total lines drawn for the day, not including the current daily pivots (current-day weekly pivots are transposed to my daily chart). There was alot more going on that led up to the low and just as much that led to the "marginal" rebound by end of session. #5) For the love of God paint those volume bars to correspond to each candle they match up with ;-)
I attached a peak of the chart that I traded off of on Friday.
Easiest way to see the pivots that I posted as well as the pivots that David_R posted is to download Think or Swim (and i believe its still free to do so). Make a two chart grid and then "edit studies" to add the daily and weekly pivots to each respective chart for a said instrument.