Welcome to NexusFi: the best trading community on the planet, with over 150,000 members Sign Up Now for Free
Genuine reviews from real traders, not fake reviews from stealth vendors
Quality education from leading professional traders
We are a friendly, helpful, and positive community
We do not tolerate rude behavior, trolling, or vendors advertising in posts
We are here to help, just let us know what you need
You'll need to register in order to view the content of the threads and start contributing to our community. It's free for basic access, or support us by becoming an Elite Member -- see if you qualify for a discount below.
-- Big Mike, Site Administrator
(If you already have an account, login at the top of the page)
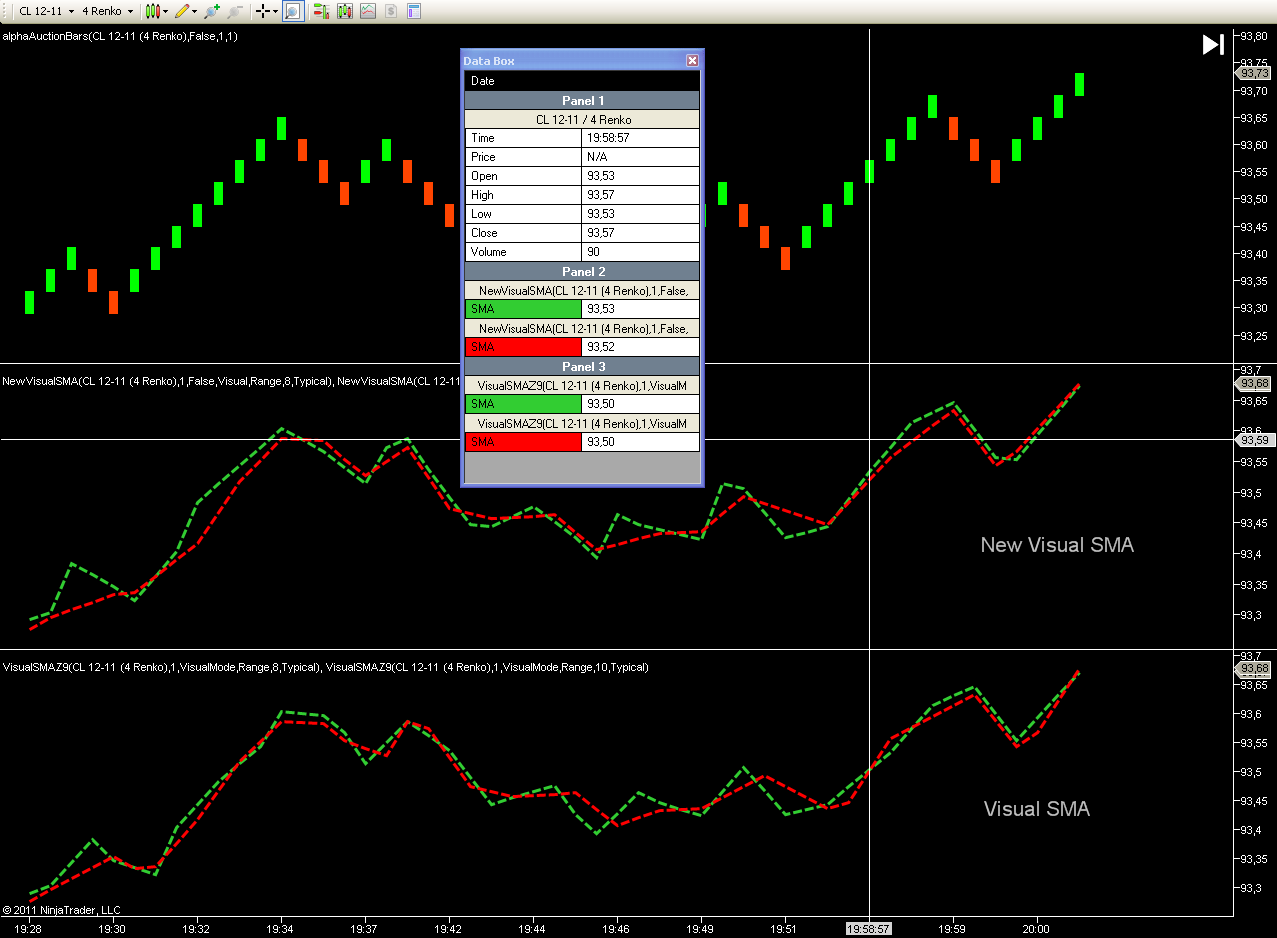
You should compare the old VisualSMA against the new VisualSMA and you will find that they are very similar, except that the lag was reduced.
Below is a comparison (on historical data) of the VisualSMA and the NewVisual SMA. If you look at the data box you will see that the new VisualSMA leads the old VisualSMA in an upmove.
I can't explain why but the old Visual SMA works for me. Maybe it's a better fit with the RenkoHybrid bars. I've been trading my live account for part of October and all of November with an almost 100% success rate. I really don't want to change anything. I want to keep the same set-up and hopefully become more confident with what I have.
Sorry the anaShadedMAs has nothing to do with the Visual SMA, it is not a multi-timeframe indicator but a simple set of two moving averages.
I will not make the old version of the VisualSMA available to the public again, because the newer version is more accurate, more robust and much faster to load. Also, I have not seen a single argument so far in favor of the old indicator.
If anybody wants an older version of the VisualSMA, please send me a private message. I will then make it available, but would like to understand the reasons, why somebody would prefer it to the new version.
Your new versions of your indicators are Great! I use them extensively on many of my charts and the load times have been cut down significantly.
I use 4 of your ema's and 4 of your sma's on one chart which leads me to a question or maybe a suggestion for a rainy day addition. (if you think its a useful idea of coarse)
Is it possible to add a user defined text field that would display on the MA line itself or maybe the hard right edge of the chart where the MA line ends. That way you could label each line for quick ref. (5R or 5min or 5T ect.)
It's just hard to keep track of which line is which when you have 8 different ones on the same chart.
The code can be used for a strategy, however - even if compared with the strategy mode of the VisualEMA - it is quite a bit different.
Accuracy on Backtests:
I will only compare it to the strategy mode. The strategy mode of the VisualEMA is specificly designed for use with historical data, and has the lag eliminated as much as possible, without repainting. On the chart below you will see that the real VisualEMA leads the indicator which was coded as above by one bar. This increases the accuracy of any backtest.
The VisualMode is even more accurate, but it repaints over the interpolation period. It should not be compared to the code snippet above. The same applies to the One-Tick-Correction mode.
CalculateOnBarClose = false:
Again the VisualEMA can be used in CalculateOnBarClose = false mode in strategy mode. There is a small lag for the first bars after the transition from historical to real-time data, but this is the price to be paid for the lag reduction on historical data. You cannot have both. The yellow indicator which follows the code above, cannot be easily used in CalculateOnBarClose = false mode, as it will neither produce a step function nor an interpolated indicator.