Welcome to NexusFi: the best trading community on the planet, with over 200,000 members Sign Up Now for Free
Genuine reviews from real traders, not fake reviews from stealth vendors
Quality education from leading professional traders
We are a friendly, helpful, and positive community
We do not tolerate rude behavior, trolling, or vendors advertising in posts
We are here to help, just let us know what you need
You'll need to register in order to view the content of the threads and start contributing to our community. It's free for basic access, or support us by becoming an Elite Member -- discounts are available after registering.
-- Big Mike, Site Administrator
(If you already have an account, login at the top of the page)
Not sure what you're thinking of here, since TICK is based on underlying securities. We're checking and I'll let you know if we find a DTN indicator of any kind for crude, oil, WTI, etc.
Robert
Can you help answer these questions from other members on NexusFi?
comparing my sources of data, trying to understand why such a difference in the sierra w rithmic feed. all charts are 5 min nyse tick with 10 period sma. basically just looking for divergences and tick extremes. if anyone has a similar chart, from a more different feed, i would be interested to compare. see the average in relation to the zero line
Since TICK is data-provider dependent, there is no "right" data. A friend I used to talk to on TOS would have a +1100 TICK, and my IQFeed-provided TICK would be at 950, as an example. That's why it's good to use as a supporting tool, but not the centerpiece of one's trading decisions, IMO. I do not mind variations in the magnitude of the extremes, but what you show above "bothers" me in that new highs were shown by the barchart feed (provided by Sierra) about halfway through, but not the other. I have said before that I would start a thread to compare differences in TICK so maybe I will do that this weekend.
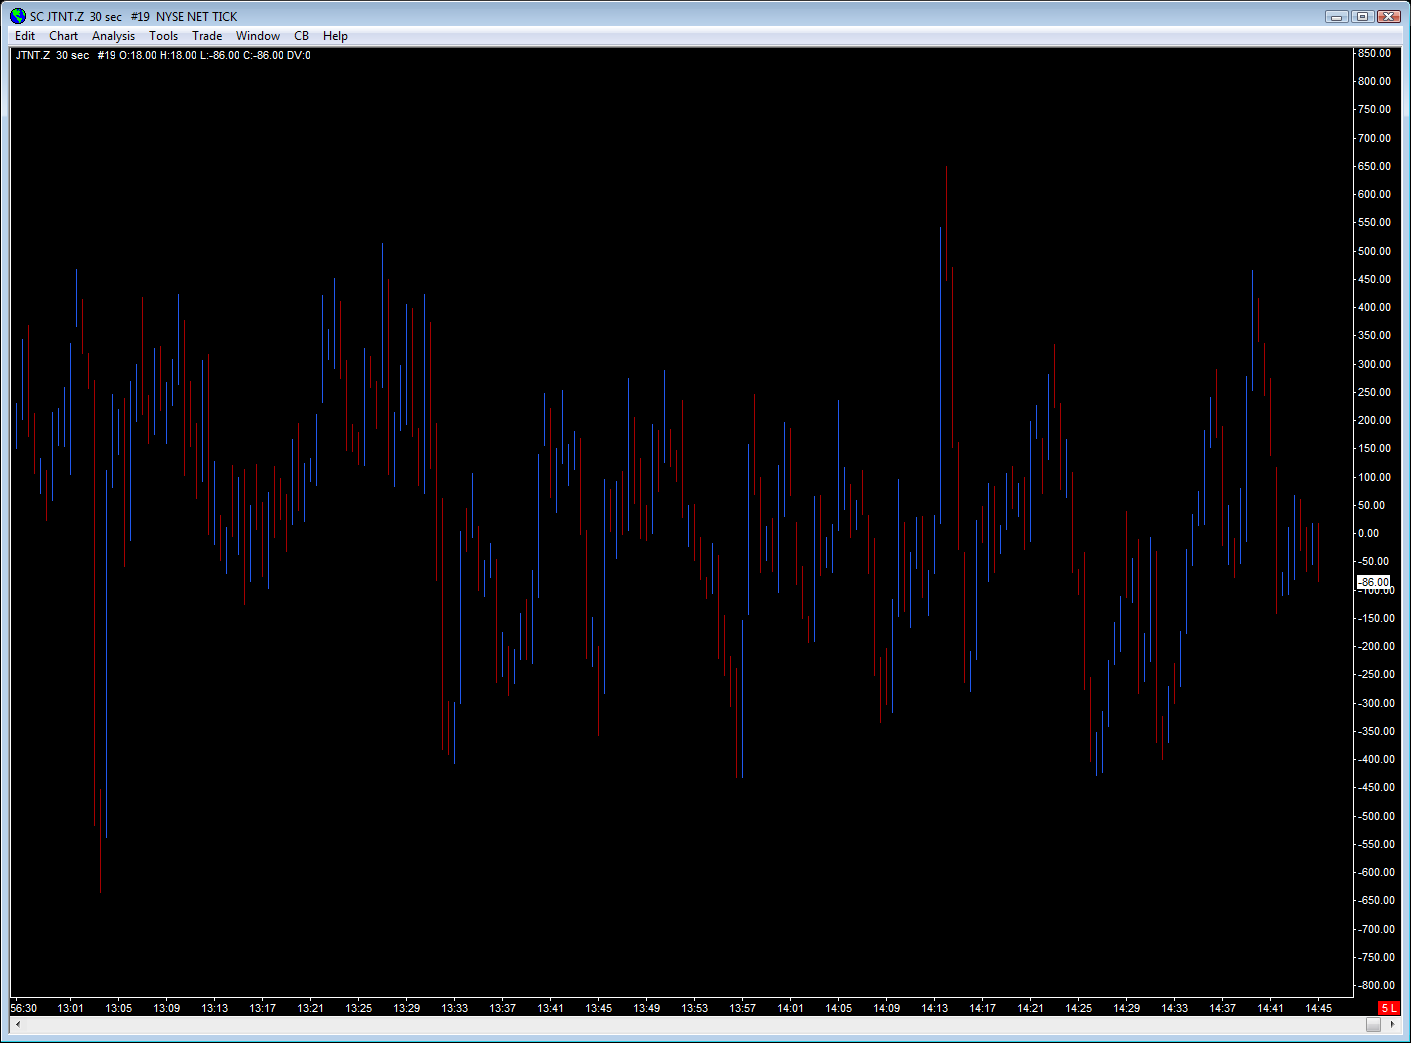
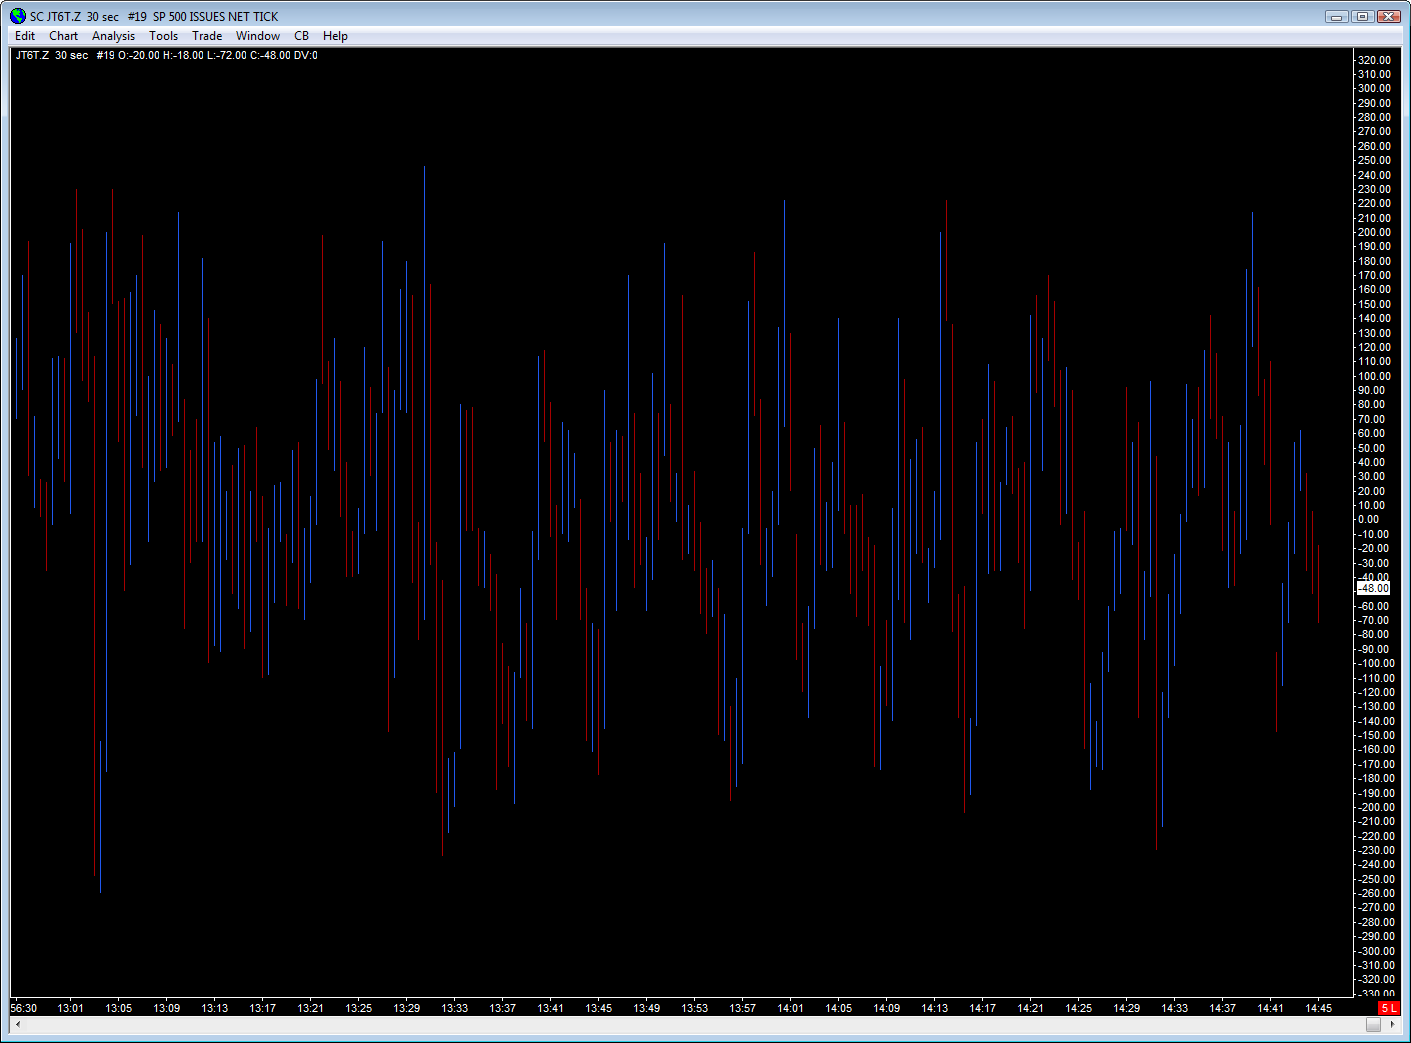
@Big Mike, could you perhaps post a chart of the NYSE TICK vs. the S&P TICK for today, using 30 second bars (hi-low bars would be fine)? I would love to see how the S&P TICK looked at 1:30pm ET (compared with the rest of the day before it and compared with the NYSE TICK).
The only breath indicators I use is the TICK and an ADV/DEC histogram.
For now I have both up, the S&P and the NYSE.
On one hand, the NYSE is slower to react, we are talking about 3000 stocks against 500 of the S&P. On the other hand, it's not so spiky, making the reading a lot smoother.
A work in progress...
In terms of the ADV/DEC histogram...
I use the S&P500 Issues Advances and the Issues Decliners to calculate the histogram so I can have the number of stocks and then I use the Adv/Dec ratio to follow the high and low where I have alerts programmed saying - breath made new highs or breath made new lows.
Again, I also have the NYSE so I can compare both.
If I become half a percent smarter each year, I'll be a genius by the time I die
Thanks. So create new chart with advancing issues, new chart with declining issues, then add the McClellan to the advancing and have it reference the declining.
The next step would then be to go back to my ES chart(s) and do an overlay study to pull the McClellan study from the advancing issues chart and place it on my ES chart.