Welcome to NexusFi: the best trading community on the planet, with over 150,000 members Sign Up Now for Free
Genuine reviews from real traders, not fake reviews from stealth vendors
Quality education from leading professional traders
We are a friendly, helpful, and positive community
We do not tolerate rude behavior, trolling, or vendors advertising in posts
We are here to help, just let us know what you need
You'll need to register in order to view the content of the threads and start contributing to our community. It's free for basic access, or support us by becoming an Elite Member -- see if you qualify for a discount below.
-- Big Mike, Site Administrator
(If you already have an account, login at the top of the page)
In my previous post I mentioned getting stopped out due to volatility and how that affected me despite this being a sim account. The repercussions continued yesterday day as I monitored 6E on Sierra Chart while working at my desk. As I commented above, I'm using a simple breakout strategy, just to get used to SC, and it looked as if the price was breaking to the downside of a not particularly well-formed channel.
Because of the (entirely notional!) loss the day before, I hesitated, and I was aware that I was hesitating. Instead of taking a view I hummed and hawed, re-did some calculations, and generally put off making a decision. In theory I was ready to enter at 1.21155 with a TP of 1.20550.
By the time I had stopped messing around the price had already gone. I put in a limit order, thinking it might retrace, but it didn't get anywhere near. By the end of the day it was 80 pips lower at 1.20300.
What were the lessons?
Not to second-guess the system (such as it is), at least until I've got some idea of whether it might work, or not.
Not to hesitate to take action just because it makes me uncomfortable.
To put together convenience tools in SC to help me monitor what's going on.
SC already has a good deal built-in, so maybe I don't need to do anything custom. What I'd like is something similar to the calculation tool, so that I can draw a couple of lines, and have the distance between them shown.
Just wanted to put out a quick thanks for sharing this. I am in a similar situation. I have traded futures in a past life, but everything has changed since I was in it. Trying to decipher all the options and the costs and what is the best way to go. I don't need a whole lot of bells and whistles for now, just a basic platform. Everything seems to point to Sierra but all the comments about the learning curve scares me a little bit. I am a firm believer in keeping it simple. I'll keep reading and researching. Thanks again for sharing.
Hi I am a new sierra charts user, new to futures too. I have some basic questions about Sierra Chart, which I am currently running in demo mode before i switch to my funded account with Gain capital.
This sounds particularly silly, but I have entered some orders in sim mode, and I am just not sure if I am flat. It currently displays as follows:
I can see I have two orders there, one in red, a sell at 4168, one in purple, a buy at 4170. I have tried looking at Trade positions window (it comes up empty) and the trade activity log which seems to have fewer trades than I think I did. Can any one offer an opinion as to whether these trades are showing up as history - or if they are still active?
The sell in red is a short entry, the buy in purple is that short's exit.
Since you are flat, you wouldn't see any orders in the Trade Positions window.
You can see that trade in the Trade Activity log. Be sure to select the correct account and symbol.
You can also set an option to draw a line between the entry and exit triangles at:
Trade >> Chart Trade Settings >> Order Fills tab >> Display Entry/Exit Connecting Lines
To color and size the lines, go to:
Global Settings >> Graphics Settings-Global >> scroll down to 'Chart Trading Order Fills Entry/Exit Connecting Lines...
@tomgilb
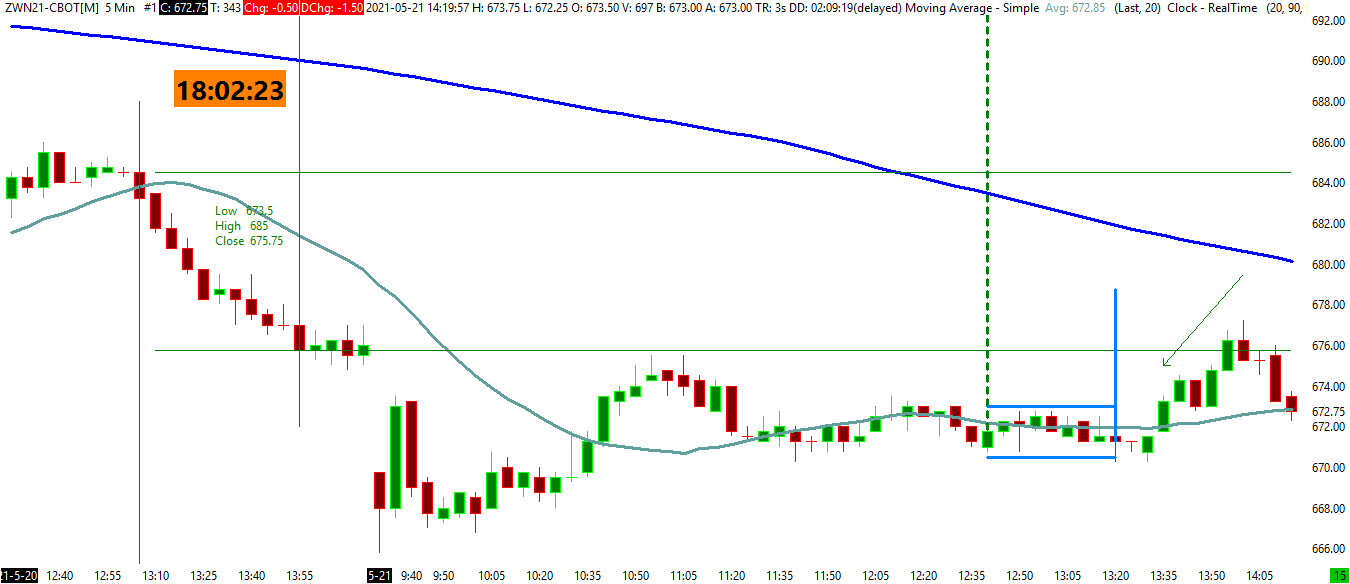
I wonder if you would tell me why there is chart data for this wheat contract where trading should cease at 1:20 central time - it seems like trading is still going past this time, to 14:05
Greta
Your chart is using Eastern Time. You can set the time zone to Central Time, to match the exchange's.
To set the global time zone, go here:
Global Settings >> Time Zone Settings
To set the chart's time zone: go here:
Chart >> Chart Settings >> Advanced Settings tab >> Time Zone.
Here you can choose to use the Global Time zone, or a separate one.
Hi @tomgilb
Here to ask your help again :-)
I am looking at a chart image with a volume study on it; I notice though there are two different volumes listed, one in the volume section, and a different value in the chart values section above it. Would you kindly tell me what these different values mean?
Greta
The value on the chart is only at the current bar. The value in the Tool Values Window (or the Compact Tool Values Window) will be at the crosshairs.
If you move the crosshairs to the current bar, those values should match.
The Tool Values Window (and the Compact Tool Values Window) will show values at the crosshairs.
The Chart Values Window (and the study's value in its chart region) will only show values at the current bar.