Welcome to NexusFi: the best trading community on the planet, with over 150,000 members Sign Up Now for Free
Genuine reviews from real traders, not fake reviews from stealth vendors
Quality education from leading professional traders
We are a friendly, helpful, and positive community
We do not tolerate rude behavior, trolling, or vendors advertising in posts
We are here to help, just let us know what you need
You'll need to register in order to view the content of the threads and start contributing to our community. It's free for basic access, or support us by becoming an Elite Member -- see if you qualify for a discount below.
-- Big Mike, Site Administrator
(If you already have an account, login at the top of the page)
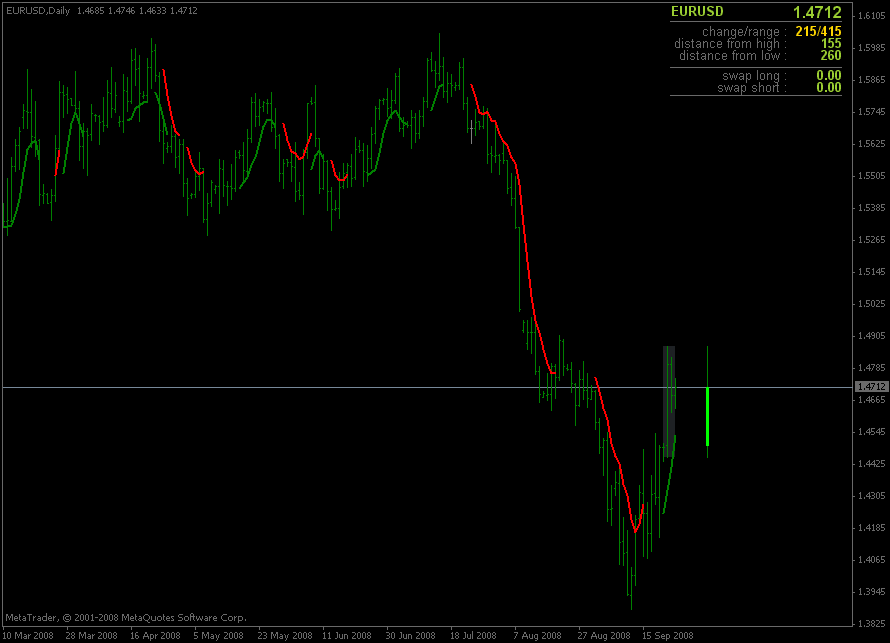
Since this is a very similar type of conversion, I was curious if anyone could take a look at it. I use this indicator a lot for three main reasons: 1. It helps me identify the trend in longer time frames. 2. It is great to trail the remainder lots with it. 3. It reduces the clutter on my charts. It appears when a trend is occurring and disappears when there is no trend. One of the reasons I like this one so much is the universal applicability of it on any time frame. The general logic for an uptrend goes something like this: 1. Identify a prospective bullish trend first by If price low > 12 prior lows, then selling pressure easing. 2. Plot bullish TD MA once condition (1) is satisfied by where TD MA = 5 bars MA of lows & extends it for another 4 bars (ie. current price bar & 3 more into future). And if within the next 4 bars & the market does record a low greater than all 12 previous lows, then the 5-bar MA will continue for another 4 bars. Otherwise, the MA is not plotted. (and opposite for downtrend) here is it can be found on MT4: (TD) [AUTOLINK]Moving Average[/AUTOLINK] - Page 3
I will greatly appreciate any help I can receive with this!
Exported using NT Version 7.0.1000.6
This is a set of indicators, which is based on the work of V. Kravchuk, who published an article on Maximum Entropy Spectral Analysis in the Valutny Speculyant. The indicators are freely available for MetaTrader, …
Exported using NT Version 7.0.1000.6
This is a set of indicators, which is based on the work of V. Kravchuk, who published an article on Maximum Entropy Spectral Analysis in the Valutny Speculyant. The indicators are freely available for MetaTrader, …
The calculation of the FTLM/STLM is based on 4 different low pass FIR filters, called FATL (fast adaptive trendline), RFTL(reference fast trendline) , SATL (slow adaptive trendline) and RSTL(reference slow trendline). Those 4 filters are calculated by a second indicator, which is called anaTrendLineMomentum.
As far as I know, the filters have been developed with Parks-McClellan filter design algorithm.
@Fat Tails i know it is, my apologies
i am just looking for someone to help me do the conversion i was refereed to this post by my friend
asking if you can help me. please