NexusFi: Find Your Edge


Home Menu


DOM bands indicator


Discussion in NinjaTrader

Updated
      Top Posters
    1. looks_one ZTR with 12 posts (8 thanks)
    2. looks_two Big Mike with 2 posts (0 thanks)
    3. looks_3 gregid with 2 posts (0 thanks)
    4. looks_4 zt379 with 2 posts (0 thanks)
      Best Posters
    1. looks_one bgtrader with 11 thanks per post
    2. looks_two FutureScalper with 6 thanks per post
    3. looks_3 GoldStandard with 5 thanks per post
    4. looks_4 ZTR with 0.7 thanks per post
    1. trending_up 54,937 views
    2. thumb_up 30 thanks given
    3. group 20 followers
    1. forum 32 posts
    2. attach_file 15 attachments


Search this Thread
  #31 (permalink)
 
Cachevary's Avatar
 Cachevary 
Russia,Khabarovsk
 
Experience: Beginner
Platform: NT
Trading: Gold
Posts: 407 since Feb 2014


ZTR View Post
I really just got this into usable form and do not have many charts of it as it is not persistent. I think Zondor will have a version of DOM_Bands soon that works in both 6.5 & 7 in conjunction with the GomRecorder to make the data in this indicator persistent.

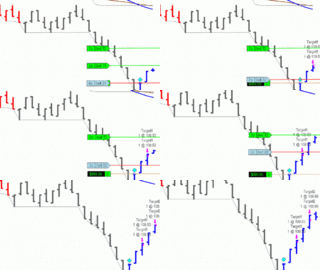
The Chart shows that as the market rallied both DOM bands rose, and the market stalled with this huge supply being chased by huge demand had run its course. After this the Market began a sell-off. A 2nd entry happened when the delta band touched ask band. Hard to see on this chart. Another interesting thing on this chart is the visualization of a buy-program (or lots of them) hitting the market & causing a huge spike on the BSV_Line. This is has been made persistent by Zondor, but do not know when, or if, he has posted it.

Once I get the latest version and start saving data I'd like to post the scenarios this indicator help clarify: The major ones are:

Throw-over - Delta Band crosses the Ask band. Happens when there TotBid >> TotAsk - a sign the market is not going any lower
Throw-under - Delta Band crosses the Bid band. Happens when there TotBid << TotAsk - a sign the market is not going any Higher
Delta Touch Ask - Running out of people willing to sell at lower levels.
Delta Touch Bid - Running out of people willing to buy at higher levels.

Many times once one of the last two are met the market moves so that the other is touched. Happens clearly in the attached chart.


I know the poster wouldn`t reply,but can anyone suggest why the Bid side of the bands(blue line) is on the negative side with the ''-'' sign?Second question is,why the Dombands indicator ignoring timeframes?

thank you


Reply With Quote

Can you help answer these questions
from other members on NexusFi?

Trump Lands in Beijing on CPI Day: Iran Peace Expires To …
Prediction Markets & Event Contracts
$500M Riding on World Cup 2026: France/Spain Co-Favored …
Prediction Markets & Event Contracts
June 15 Peace Odds Surge From 3.6% to 12.25% After Trump …
Prediction Markets & Event Contracts
Six Days to Kickoff: World Cup Prediction Markets Hit $1 …
Prediction Markets & Event Contracts
April FOMC Minutes: Most Divided Fed Since 1992 -- Many …
Traders Hideout
 
Best Threads (Most Thanked)
in the last 7 days on NexusFi
NexusFi site changelog and issues/problem reporting
1 thanks
Darmok and Jalad at Tanagra
1 thanks
  #32 (permalink)
psyshark1
Moscow Russia
 
Posts: 1 since Mar 2016
Thanks Given: 0
Thanks Received: 0

Can someone please post this indy again? Link on a first post is not working.


Reply With Quote
  #33 (permalink)
 
DavidHP's Avatar
 DavidHP 
Isla Mujeres, MX
Legendary Market Wizard
 
Experience: Advanced
Platform: NinjaTrader
Broker: Ninjatrader / Optimus Futures / AmpFutures
Trading: NQ / ES / 6E / 6B / CL
Frequency: Every few days
Duration: Minutes
Posts: 1,816 since Aug 2009
Thanks Given: 11,765
Thanks Received: 3,043


psyshark1 View Post
Can someone please post this indy again? Link on a first post is not working.

https://nexusfi.com/download/ninjatrader-7/workspace-chart-templates/403-download.html


Rejoice in the Thunderstorms of Life . . .
Knowing it's not about Clouds or Wind. . .
But Learning to Dance in the Rain ! ! !
Follow me on X Reply With Quote


Last Updated on March 15, 2016


© 2026 NexusFi®, s.a., All Rights Reserved.
Av Ricardo J. Alfaro, Century Tower, Panama City, Panama, Ph: +507 833-9432 (Panama and Intl), +1 888-312-3001 (USA and Canada)
All information is for educational use only and is not investment advice. There is a substantial risk of loss in trading commodity futures, stocks, options and foreign exchange products. Past performance is not indicative of future results.
About Us - Contact Us - Site Rules, Acceptable Use, and Terms and Conditions - Downloads - Top
no new posts