The original question really had to do with using trends for day trading. Agree that one could observe a larger time frame (i.e Daily) trend for
context and to form a
bias for day trading off a smaller time frame (i.e 5 M). That is what most trades do anyways.
Given that, how do you know if you missed it. More importantly, how do you know where or when it is going to end? Or even, how do you know a trend has started?
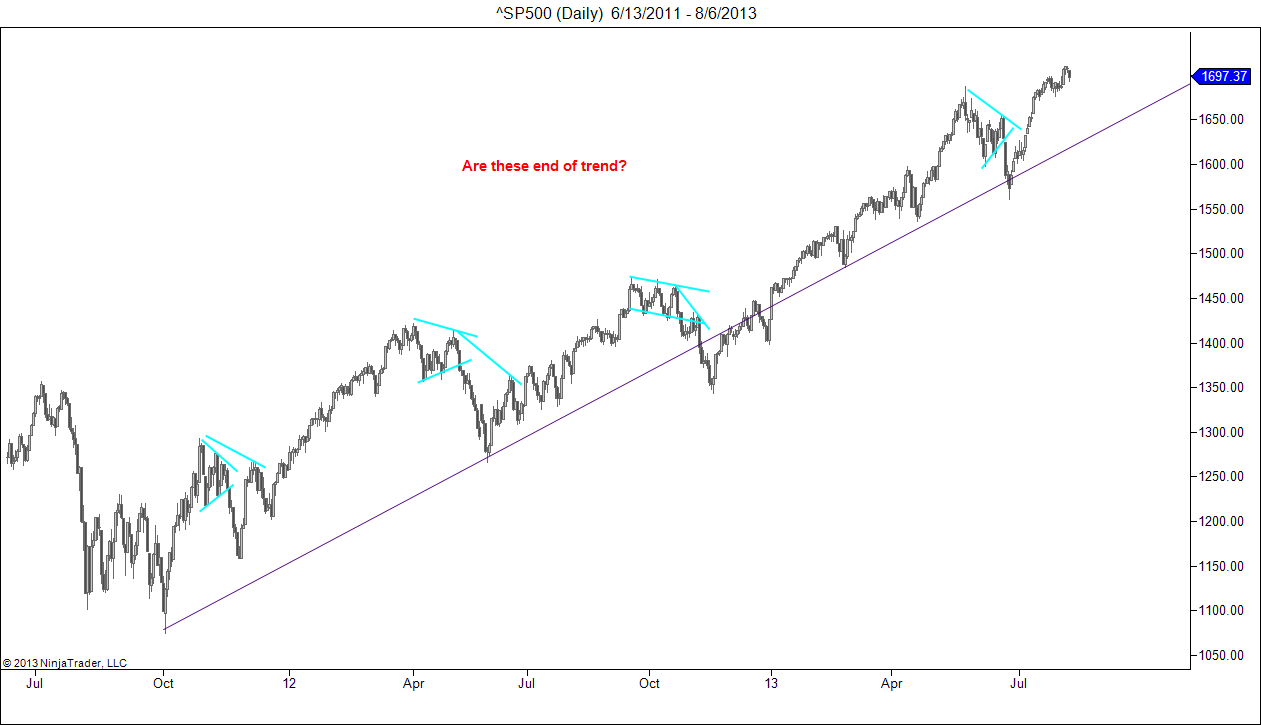
Let's forget about the standard answer of HH, LL, LH and HL, etc. for the moment and consider the run in SP500 since the lows of October 2011. Who on this board would have genuinely believed (if not predict) that this run would go this far for 22 months and seemingly non-stoppable. Did we miss the trend in Nov 2011, June and November 2012, or June 2013? When do one decide that trend is missed? Are we still in the trend or at the beginning of a move to 2000 and 3000 mark? Too many unknowns.
Average buy and hold during the last 18 months would have netted 35% or more. But not many would have held a position based on trend for that long because at every century level since the 1100 in October 2011, every new 100 point gain was a place for trend to end. People would liquidate and wait to buy pullbacks and end up chasing the trend to the next 100 level. Some are still in cash since then and still guessing the trend will end soon at 1700, no wait at 1800,...2000.
No one can tell when or where a trend starts, how long will continue or when or where it will stop. In contrast, for day trading, ranges have defined swings once a high or low swing is formed and can be traded with no more risk than trading the trend. The difference is that the
range trading provides 70% availability of potential trades compered to the availability of 30% trend trades with a higher risk of
whipsaw. That is one reason in addition to
volatility that option traders love trading ranges for non-directional trades.
All these assumes the trader has the proper understanding of the market, trading knowledge, and proper tools.
Cheers!