Welcome to NexusFi: the best trading community on the planet, with over 150,000 members Sign Up Now for Free
Genuine reviews from real traders, not fake reviews from stealth vendors
Quality education from leading professional traders
We are a friendly, helpful, and positive community
We do not tolerate rude behavior, trolling, or vendors advertising in posts
We are here to help, just let us know what you need
You'll need to register in order to view the content of the threads and start contributing to our community. It's free for basic access, or support us by becoming an Elite Member -- see if you qualify for a discount below.
-- Big Mike, Site Administrator
(If you already have an account, login at the top of the page)
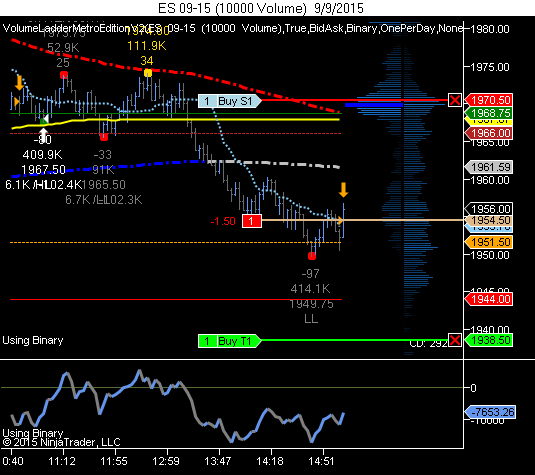
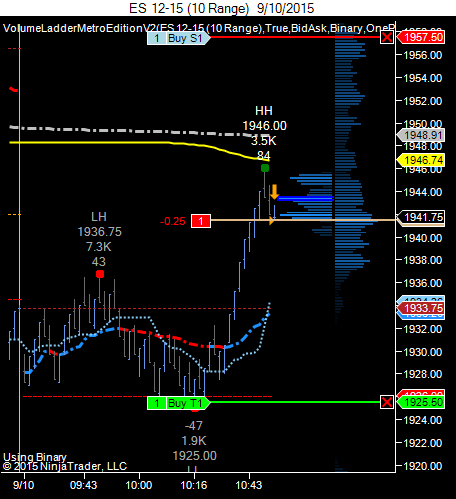
Entered market. This is a screen shot of the counter trade chart/account. I'm short there but my primary decision was on the primary chart to go long. Bias for the day is confirmed short. Taking a chance on a counter trend trade long based on price action around this level. I was watching the cumulative delta indicator ( bottom right corner ). This is part of PriceActionSwingPro... the indicator that's plotting the swings. The CD cycled through from 3000 negative to near zero and then jumped over 1000 very quickly. This behavior together with the price action up and down around this level and then breaking above the median line ( light blue dots ) for the 1st time in a while led me to take this trade.
Edit: monday morning qb: Where did this idea come from? Ridiculous. Thank you journal!
Can you help answer these questions from other members on NexusFi?
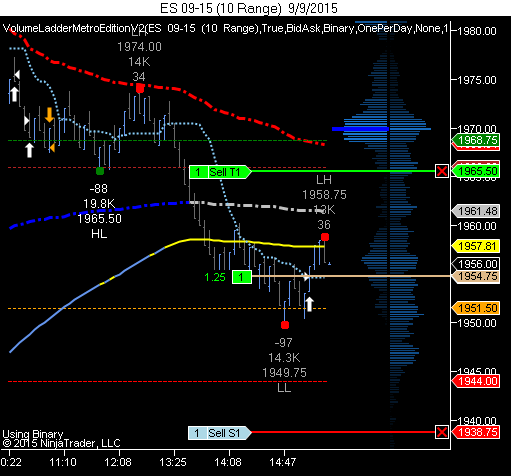
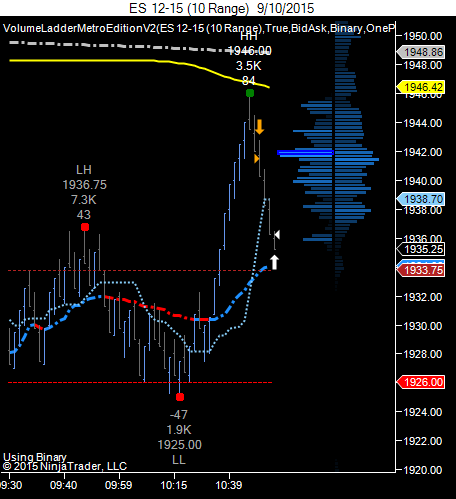
Here's the primary trade/chart long with revised price target.
Edit: I could have closed the trade for a 2 point gain but I want to learn to hold on longer for bigger moves.
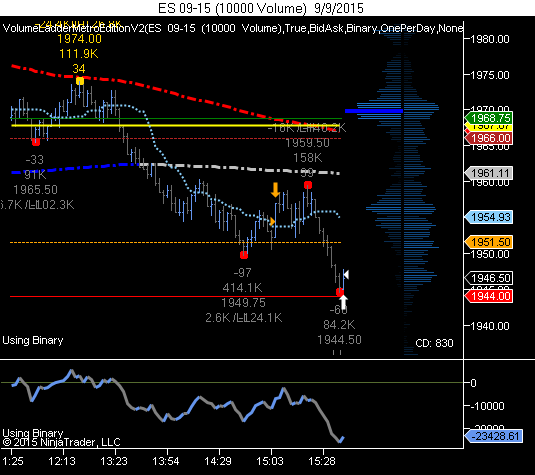
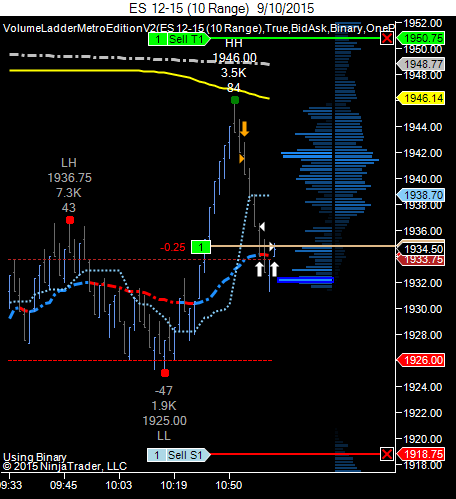
DayTrade2 ( the counter trade ) wins again! This time it was in the direction of my short bias on this big trend down day. As stated previously my impulse was to go long and that trade failed.
At least I'm consistantly winning in the DayTrade2 account so far.
Edit See post 61. This trade was entered on criteria that had not been previously established. Use of the cumulative delta and chop around prior day levels.
I'm not sure about the accounting of the account performance from NT. My manual tracking scores it this way:
DayTrade starting value: $9,537.50. Current value $7,200 = ($2,337)
Yet the account shows ($2,050).
And my accounting:
DayTrade: -28.62 points, ($1,425)
DayTrade2 starting value: $10,000. Current value $12,175 = $2,175
Yet the account shows $1,975
And my accounting:
DayTrade2: 25.12 points. $1,250
At the end of this week I'm resetting the accounts and starting over.
Initiated short trade. Day started with mixed bias. Price shot up quick and far and looks rejected at W-VWAP. Also 2 of my systematic systems are now short.
Long here on a big bounce in Oil in last 15 minutes from 45 to 46.40. Also on d-vwap and a "hole" in the volume ladder above us.
I did not look at the other correlated markets before making this trade. I didn't have time to check on them due to distractions and my small screen size.
I think I still would have taken the trade even though they are broadcasting mixed signals.
The eruo dollar ( 6E ) is showing Euro strength... that's bearish for US stock ( usually ) due to the negative correlation of that. News out of Eurozone today is that governing council member Liikanen said they will continue asset purchases beyond Sept. 2016 if necessary.
6J ( Jap Yen ) is weakening against USD. Again, bearish for US stock.
The correlation with oil is strong and moves in oil are volatile and so I think using oil moves to confirm trigger for intra day trades makes sense right now.