Welcome to NexusFi: the best trading community on the planet, with over 150,000 members Sign Up Now for Free
Genuine reviews from real traders, not fake reviews from stealth vendors
Quality education from leading professional traders
We are a friendly, helpful, and positive community
We do not tolerate rude behavior, trolling, or vendors advertising in posts
We are here to help, just let us know what you need
You'll need to register in order to view the content of the threads and start contributing to our community. It's free for basic access, or support us by becoming an Elite Member -- see if you qualify for a discount below.
-- Big Mike, Site Administrator
(If you already have an account, login at the top of the page)
By the way Gary, when it comes rollover time here's the basic procedure, using CLK to CLM rollover as an example.
1) Be sure you are disconnected from your data provider
2) Backup your data file in your data folder, just create a copy in case anything goes wrong
3) Edit->Adjust Data
4) Add/Subtract amount: let's say CLM settles +.30 higher than CLK. You will want to put 0.30 in the box, and click OK.
5) Exit SC
6) Copy the newly adjusted data file and rename the copy to fit the CLM parameters (including month letter, number, etc)
7) Restart SC
8) Change the symbol to the new symbol name on all your charts
9) Connect to your data provider
10) To be sure you have new data if it's already past rollover, right-click on a bar where you want to refresh data (the 18:00 bar on rollover day for example), and do a "Delete and Download Data"
Seems like a lot but it's a very flexible process that is quite fast once you do it a time or two, and the nice thing is you have complete control over the data, the range to back-adjust if you like, etc. You can even modify the volume info if you like.
There is also an automatic rollover process, but I have not used it as I don't trust it and prefer to know exactly what is being adjusted and at what times, and by how much.
@Big Mike, this is definitely one way to go, and has the advantage that it's very hands-off, just download the data at rollover. But it has a couple of disadvantages:
1) When rollover occurs, you must re-download ALL data since it has all been back-adjusted, and therefore you overwrite all your old data, and since you can only get 120 days of tick data, you can never have more than 120 days of tick data for an IQFeed continuous contract. This is not an issue for some people, but some people like to compose volume charts (or profiles) that may span 6 months to a year, and need tick data for that period, not minute data.
2) IQFeed will control the rollover time and amount. For ES, it's fairly straightforward, but even then I like to roll a day later because the volume does not shift to the new contract until Friday, but IQFeed will roll on Wednesday evening. Also, if I want to customize the rollover (shifting one day -5.00 but another -4.75 for example) I can't do so in this situation. For a contract like CL, since there is no real rollover day defined, IQFeed may roll at a different time than some people like, as some people will prefer to stick with the old contract a day or two longer, and some may like to roll a little early.
The procedure in NT is very simple, and even for SC with all the customizations available, it does not take long (maybe 5 minutes to shift the data for my entire 4GB ES data file).
By the way, the above instructions and other methods for rolling over are outlined here at SC's web site.
SIM trading the pre-open. This is where the order colors get a little confusing. Bracketed orders also show before they trigger. Everything is there in the text though...
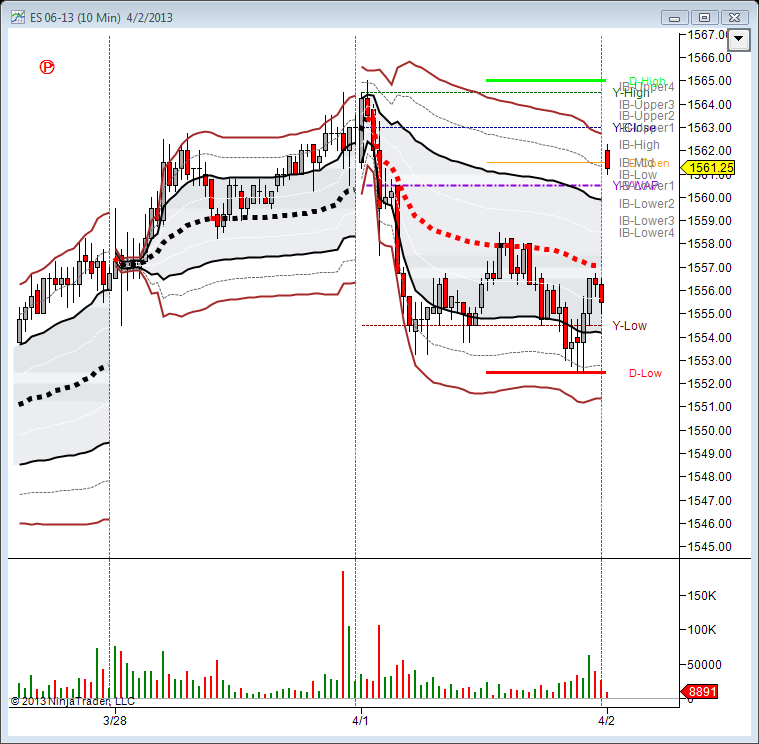
Looks like it will open in balance. Per Jim Dalton I have 5 trade options. I would prefer only one
Balance area rules starting with inside days:
1.Market may slightly extend the range in either direction, stays in balance. Patience is in order.
2.Market explores upside breakout and is met by aggressive sellers; prices fail to be accepted above the breakout. Fade the price probe failurethe potential target is for rotation to the opposite end of balance.
3.Market explores to the upside; higher prices receive the unexpected response and attract even more buyers. Higher prices are accepted, breakout is successful. Go with price acceptance in the direction of breakout.
4.Market explores downside breakout and is met by aggressive buyers; prices fail to be accepted below the breakout. Fade the price probe failurethe potential target is for rotation to the opposite end of balance.
5.Market explores to the downside; lower prices receive the unexpected response and attract even more sellers. Lower prices are accepted, breakout is successful. Go with price acceptance in the direction of breakout.