Welcome to NexusFi: the best trading community on the planet, with over 200,000 members Sign Up Now for Free
Genuine reviews from real traders, not fake reviews from stealth vendors
Quality education from leading professional traders
We are a friendly, helpful, and positive community
We do not tolerate rude behavior, trolling, or vendors advertising in posts
We are here to help, just let us know what you need
You'll need to register in order to view the content of the threads and start contributing to our community. It's free for basic access, or support us by becoming an Elite Member -- discounts are available after registering.
-- Big Mike, Site Administrator
(If you already have an account, login at the top of the page)
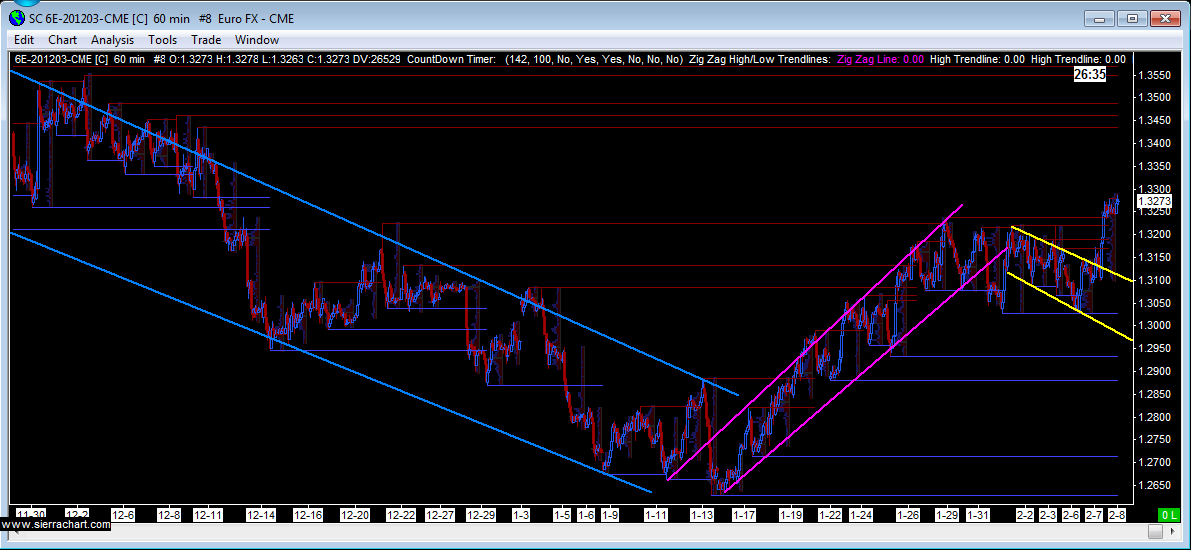
It didn't correct enough to be called a technically correct 3PDH, but it's doing everything else correctly as expected, approaching the wave retrenchment that's been sitting there. Now, how many are going to get squeezed and create an exaggereted move past the 1.3400? Based on today's move I expect 1.3500
Can you help answer these questions from other members on NexusFi?
Around 3400 maybe a little more. This has been coming for days the only surprise is it took so long to happen. There was far far to much short interest to drop.
Markets move higher to shut of buying and find supply.
Markets move lower to shut of selling and find demand as Trafford said.
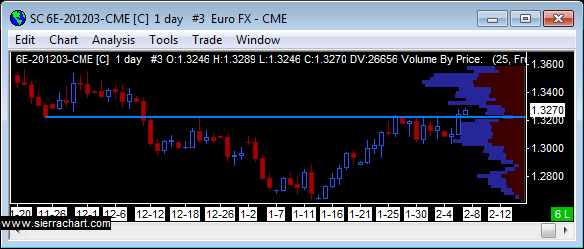
If you look at the daily, we've just ever so slightly peeked above the prior resistance level. If this truly becomes support, we should trade into the 3500 area. If this proves to just be a failed breakout attempt, I would expect a return back to 3000's, where we will once again see if that support holds or breaks. If breaks, then down to 2700 is a possibility.
So a long right here would need a wide stop in my opinion, as price could very easily fall back into the range of the last few days and trade near 3000 before once again exiting that sideways accumulation and moving higher.
A short would be better served until we move down a bit back below 3200. Depending on how well 3200 is supported or not, I would see a short working down to the 3100 or 3025 area or so, which is basically the consolidation range of the last several days.
Markets move higher until supply outweighs demand. Your choice of words implies that the market is some kind of animal that seeks things out of its own accord. I find such an mental image of the market would probably distort my objectivity. It's down to market participants at the end of the day - the crowd.
You can discover what your enemy fears most by observing the means he uses to frighten you.
I think Weekly and Daily charts provide a better view. Plotting weekly and daily levels on your smaller timeframe charts give you an advantage of seeing more quickly what takes places when the market trades at those levels.
Why I like failed lows and highs at key levels is that in the case of failed lows they confirm that sellers are no longer in control or interested and the risk is to the downside. Now that is only my belief and at the end of the day we are only trading our beliefs, right or wrong.


 dont believe anything you hear and only half of what you see