Welcome to NexusFi: the best trading community on the planet, with over 150,000 members Sign Up Now for Free
Genuine reviews from real traders, not fake reviews from stealth vendors
Quality education from leading professional traders
We are a friendly, helpful, and positive community
We do not tolerate rude behavior, trolling, or vendors advertising in posts
We are here to help, just let us know what you need
You'll need to register in order to view the content of the threads and start contributing to our community. It's free for basic access, or support us by becoming an Elite Member -- see if you qualify for a discount below.
-- Big Mike, Site Administrator
(If you already have an account, login at the top of the page)
Day Trading Support/Resistance Levels on the E-Mini S&P500 Futures
It's a conundrum. Everybody wants to make money now.
I personally think everyone should start off trying to scalp ticks, say on the Bund or something like that. (not that I did)
Once you have the skills to get some ticks under your belt (which will of course mean watching the market), you can start to look at expanding on those skills a little by looking for longer term trades.
There's only 1 open on the any market each day and to get a good feel for it, it really helps to watch the open. So 1 open a day, watch what? A hundred, two hundred opens and you get a good feel for the participation, direction, pace of the market and have an idea of the tone for the day.
That will probably depend on who you ask. Many will see B as a resistance-turns-support point of interest. In reality, it's likely that the entire A to B range is significant, not just one point or the other.
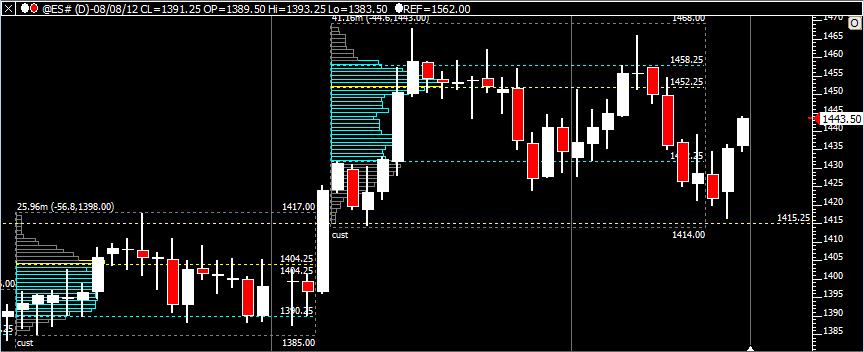
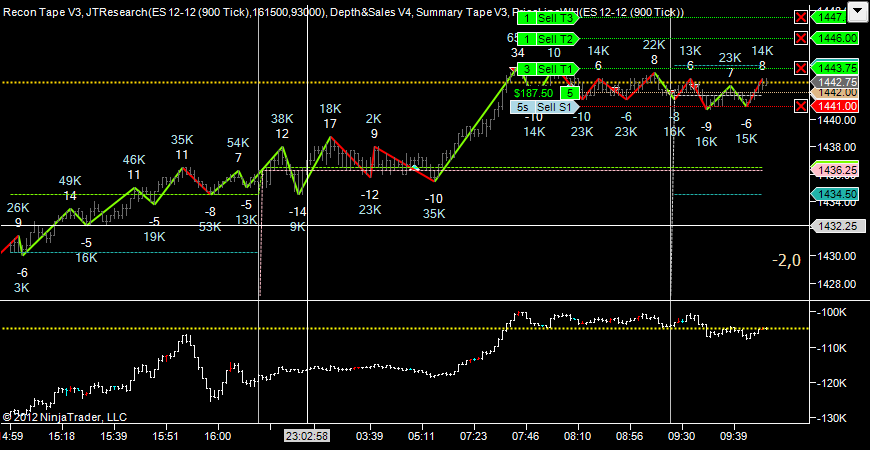
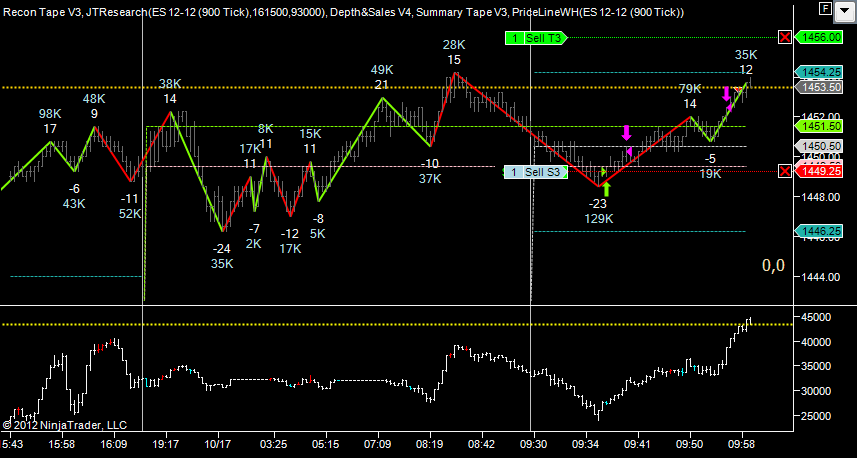
Here was the picture from the before open today. We are in a range , traversing from bottom to top, so bias is long...
Support built up before the open @ 1441.50. Low we got to was 1440.75, I initially got long 1441.75 but I screwed up the trade and ended up in with 2x my normal size so on I scratched that. After scratching, I thought it was still worth playing, so I got in @ 1442.
Why scratch & re-enter? Well after putting on double the position, my priority was to get out.
The entry was 5 ticks from the low & it went against me 4 ticks. The backstop was earlier on when down at 1440.75 - no-one wanted to sell into it, just 144 contracts traded. Then later down at 1441 it was confirmed with 121 contracts selling into it and nothing more.
See how we have 31, 73, 121 hitting the bids on that last leg down?
Anyway - the trade looked late at the time I put it on but afterwards 5 ticks seems pretty insignificant.
I'm not going to turn this into a journal but here is the way I see things pre-market:
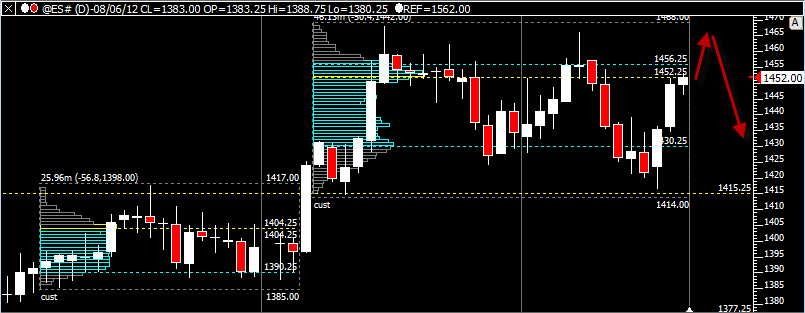
17th October
Whilst I don't expect this range to last forever, I still favour us topping out & heading back to low 1400's.
LVN @ 1460.75 - but I'd expect we'd at least test 1468 again rather than bouncing off the LVN, perhaps even a pop thru 1468 to see if there's buyers up there.
The above chart is a level higher than I actually trade - but I do like the bias. If we look at the past 6 months, you can see how the strict S/R levels have not faired anywhere near as well as using value to trade S/R longer term. Certainly, it's a wonderful way to set bias.
This isn't a million miles from what FT71 does longer term but it was actually Kam at L2ST that taught me how to practically apply the theories.
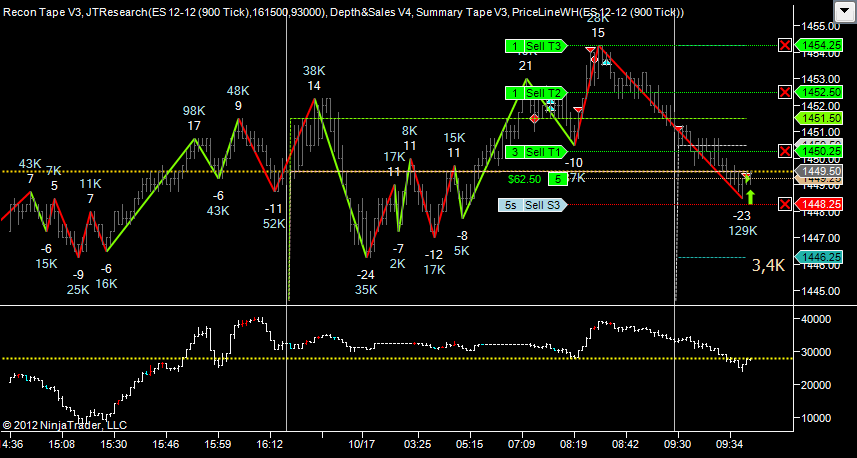
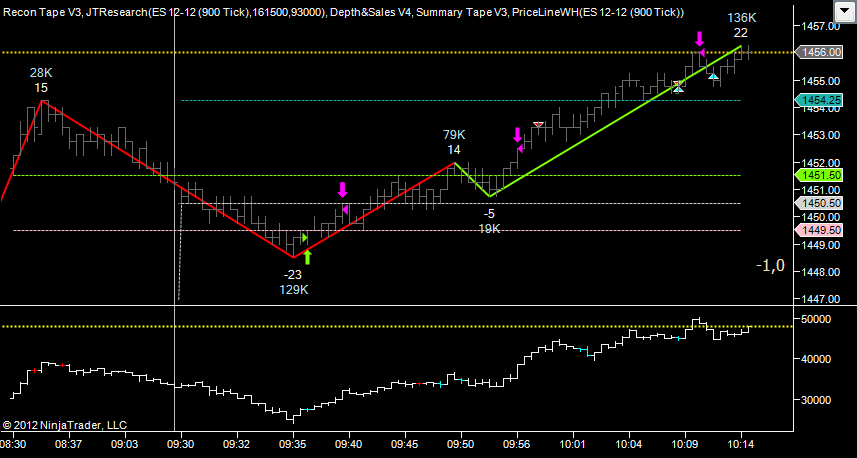
My "support" level in this case was yesterdays close - the 1449.50 level from my prior post. This is one of those 'shot thru the level' trades. Wait @ the level until the order flow tells you that it's worth a shot.
Market actually moved to 1448.50. Entry was a bit late but I was 'chicken' and got in 1-2 ticks worst than I could have.
Target 1 already done by the time I posted this - need to get thru 1451.50 and then I think I'm good.
Got up to 1456, 1005 traded and I was one of them.... It did go through again later - but it's always nice to get a fill first time there.
MAE on the trade was 1 tick but I did go in at market so I got the offer of 1449.25 and at the time the bid was 1449 - so it did trade some more at the bid but it didn't actually tick down to a lower bid after the entry.
So there you go - no indicators, you can barely even see the individual bars. Bias and levels set before the market and just execute your plan when the market opens.
Like I say - I don't want to turn this into a journal but I'd love people to consider methods like this and maybe discuss them.
Or have I scared people off with my brutish manner???
@Silvester17 - you have me bang to rights there about indicators.
I guess that is a bit of a leap on my part considering there's 5 of them listed across the top. I should have set "price derived mathematical mumbo-jumbo" indicators.
So....
I use PriceActionSwing because I'm not interested in individual price bars. So I reckon that actually puts me ahead of the "bar by bar" traders....
The Cumulative Delta is not something I consider to be an indicator any more than price is. This is order flow.
The dotted golden line tells me where price is right now on account of you can't really tell because I keep the price bars so dark.
The other 3 things mentioned on there aren't visible as they are my dom and time&sales
Interesting perspective. I think it depends on a few things with the importance of the level being at the top of the list. For the gold trade we had a very important long term resistance level and also a key number of $1800 an ounce.
When we see levels like this then the ferocity of the rejection comes into play. If we see the level breached and then balance for awhile I will never short this as there is no rejection. I've noticed a higher than average chance of the move continuing higher in these circumstances.
However, if the level is swiftly rejected this can be a good opportunity. I will usually wait for a lower high before shorting. Whatever the case the risk reward back into value represents quite an attractive trade opportunity.