NexusFi: Find Your Edge


Home Menu


Is Trend Really Your Friend?


Discussion in Traders Hideout

Updated
      Top Posters
    1. looks_one Tunah with 16 posts (5 thanks)
    2. looks_two tigertrader with 11 posts (30 thanks)
    3. looks_3 aligator with 10 posts (2 thanks)
    4. looks_4 wldman with 6 posts (14 thanks)
      Best Posters
    1. looks_one tigertrader with 2.7 thanks per post
    2. looks_two wldman with 2.3 thanks per post
    3. looks_3 addchild with 2 thanks per post
    4. looks_4 Tunah with 0.3 thanks per post
    1. trending_up 25,548 views
    2. thumb_up 62 thanks given
    3. group 10 followers
    1. forum 52 posts
    2. attach_file 5 attachments


Search this Thread

Is Trend Really Your Friend?

  #51 (permalink)
Johno1
Geelong Victoria
 
Posts: 113 since Jan 2015
Thanks Given: 45
Thanks Received: 92


tigertrader View Post
Who gives a flying f*ck what you call yourself. Personally, I trade the market. How I trade the market is dependent on the context of the market. Why would I trade the market the same way every day, when the market doesn't trade the same way every day? The problem with any discussion on trends is that trendlines are in inevitably brought into the discussion as a metric for the beginning or end of trends. Trendlines for the most part are about as arbitrary as any tool in trading gets - you can keep drawing them ad infinitum until you make your point.

Exactly, there are most certainly trends. To trade them effectively you need to remain on the extreme right hand edge

Price charts, lines, indicators are so far behind the curve that self defeating rules need to be employed in order to fend off Risk of Ruin. Market biases change in minutes-hours usually long before they show up in even short term charts.

If you can confidently trade on this cutting edge stops become a moot point, the most you might need is a stop far outside the expected range in order to protect you from the unexpected monster move every x number of years, we all need to sleep some time.

Cheers John

Reply With Quote

Can you help answer these questions
from other members on NexusFi?
Cheap historycal L1 data for stocks
Stocks and ETFs
REcommedations for programming help
Sierra Chart
MC PL editor upgrade
MultiCharts
Pivot Indicator like the old SwingTemp by Big Mike
NinjaTrader
ZombieSqueeze
Platforms and Indicators
 
  #52 (permalink)
Johno1
Geelong Victoria
 
Posts: 113 since Jan 2015
Thanks Given: 45
Thanks Received: 92


tigertrader View Post
No - you are confusing self-fulfilling prophecy with collusion.

I would agree. If you think about the main players having their buy and sell orders spread over a range of prices, then like a political election all that is required is a small percentage acting to move the result one way or another. Inevitably that will happen.

Cheers John

Reply With Quote
  #53 (permalink)
Johno1
Geelong Victoria
 
Posts: 113 since Jan 2015
Thanks Given: 45
Thanks Received: 92


aligator View Post
The original question really had to do with using trends for day trading. Agree that one could observe a larger time frame (i.e Daily) trend for context and to form a bias for day trading off a smaller time frame (i.e 5 M). That is what most trades do anyways.

Given that, how do you know if you missed it. More importantly, how do you know where or when it is going to end? Or even, how do you know a trend has started?

Let's forget about the standard answer of HH, LL, LH and HL, etc. for the moment and consider the run in SP500 since the lows of October 2011. Who on this board would have genuinely believed (if not predict) that this run would go this far for 22 months and seemingly non-stoppable. Did we miss the trend in Nov 2011, June and November 2012, or June 2013? When do one decide that trend is missed? Are we still in the trend or at the beginning of a move to 2000 and 3000 mark? Too many unknowns.

Average buy and hold during the last 18 months would have netted 35% or more. But not many would have held a position based on trend for that long because at every century level since the 1100 in October 2011, every new 100 point gain was a place for trend to end. People would liquidate and wait to buy pullbacks and end up chasing the trend to the next 100 level. Some are still in cash since then and still guessing the trend will end soon at 1700, no wait at 1800,...2000.

No one can tell when or where a trend starts, how long will continue or when or where it will stop. In contrast, for day trading, ranges have defined swings once a high or low swing is formed and can be traded with no more risk than trading the trend. The difference is that the range trading provides 70% availability of potential trades compered to the availability of 30% trend trades with a higher risk of whipsaw. That is one reason in addition to volatility that option traders love trading ranges for non-directional trades.

All these assumes the trader has the proper understanding of the market, trading knowledge, and proper tools.

Cheers!
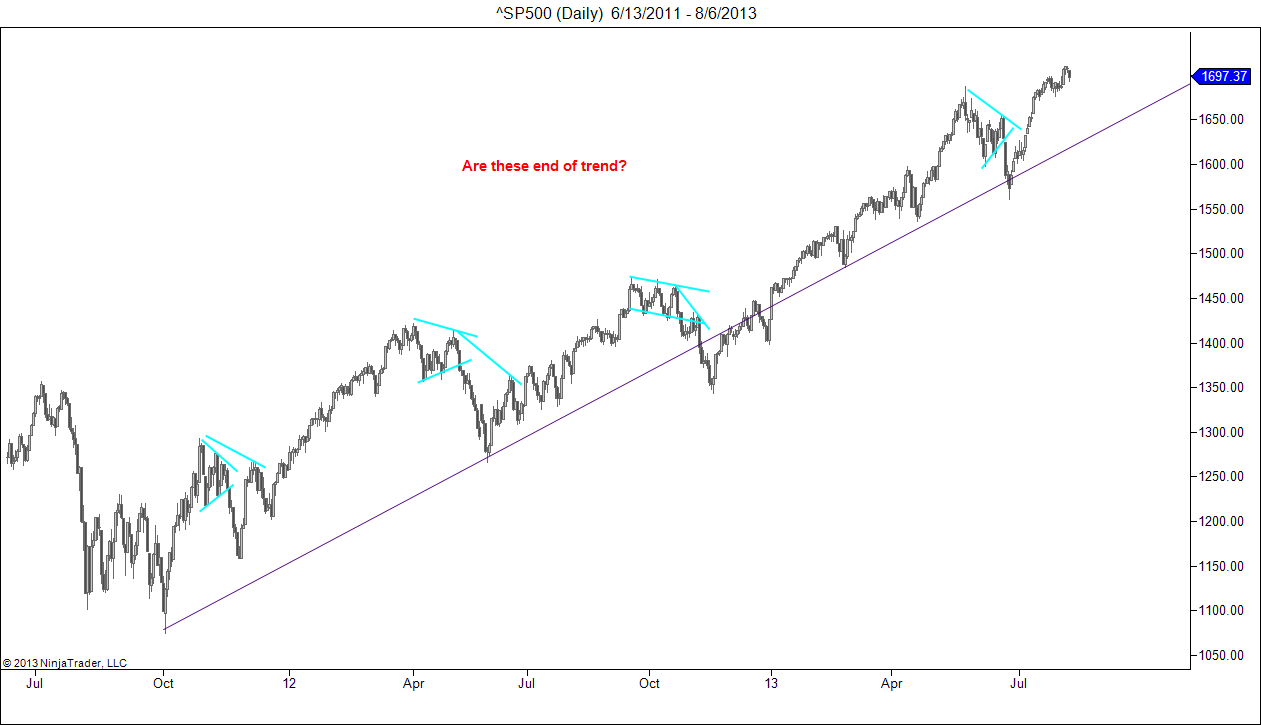


No one can ever know if the next tick will be a continuation of the trend or the first one of the reversal. I recall seeing the whipsaw song being performed on youtube, welcome to the world of the Chartist.

Reply With Quote


Last Updated on July 18, 2017


© 2024 NexusFi™, s.a., All Rights Reserved.
Av Ricardo J. Alfaro, Century Tower, Panama City, Panama, Ph: +507 833-9432 (Panama and Intl), +1 888-312-3001 (USA and Canada)
All information is for educational use only and is not investment advice. There is a substantial risk of loss in trading commodity futures, stocks, options and foreign exchange products. Past performance is not indicative of future results.
About Us - Contact Us - Site Rules, Acceptable Use, and Terms and Conditions - Privacy Policy - Downloads - Top
no new posts