Welcome to NexusFi: the best trading community on the planet, with over 150,000 members Sign Up Now for Free
Genuine reviews from real traders, not fake reviews from stealth vendors
Quality education from leading professional traders
We are a friendly, helpful, and positive community
We do not tolerate rude behavior, trolling, or vendors advertising in posts
We are here to help, just let us know what you need
You'll need to register in order to view the content of the threads and start contributing to our community. It's free for basic access, or support us by becoming an Elite Member -- see if you qualify for a discount below.
-- Big Mike, Site Administrator
(If you already have an account, login at the top of the page)
There are some 3rd party indicators that might pick it up. But really you'd have to know what to look for on the time & sales (not the chart) to identify the behavior.
In my opinion it's not possible unless you can prove order type, duration, and/or intent. Thus I really doubt indicators can do that either.
For the most part we could only know we're observing HFT by watching someone else do it or doing it ourselves. It also depends on what working definition of HFT we wanted to look at.
Other then that...
Can we look for patterns in the order flow and code indicators to identify those patterns? Yes.
Can we know we're observing HFT when we think we are? No.
HFT usually use limit orders. Then you can see how HFT play with Time&Sales (Level I) and DOM (level II). You can see absorptions by the limit orders, for example, when there are many sells market orders but the price don't fall. and viceversa.
Problem:
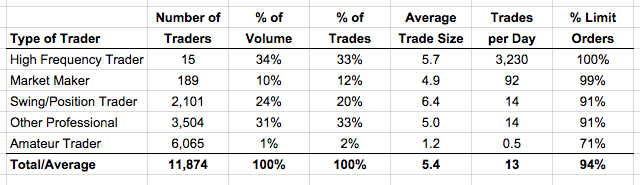
This is an outdated study which only looked at the dates between September 17, 2010 and November 1, 2010 for the eMini futures contract (December 2010 contract, symbol ESZ0).