Welcome to NexusFi: the best trading community on the planet, with over 150,000 members Sign Up Now for Free
Genuine reviews from real traders, not fake reviews from stealth vendors
Quality education from leading professional traders
We are a friendly, helpful, and positive community
We do not tolerate rude behavior, trolling, or vendors advertising in posts
We are here to help, just let us know what you need
You'll need to register in order to view the content of the threads and start contributing to our community. It's free for basic access, or support us by becoming an Elite Member -- see if you qualify for a discount below.
-- Big Mike, Site Administrator
(If you already have an account, login at the top of the page)
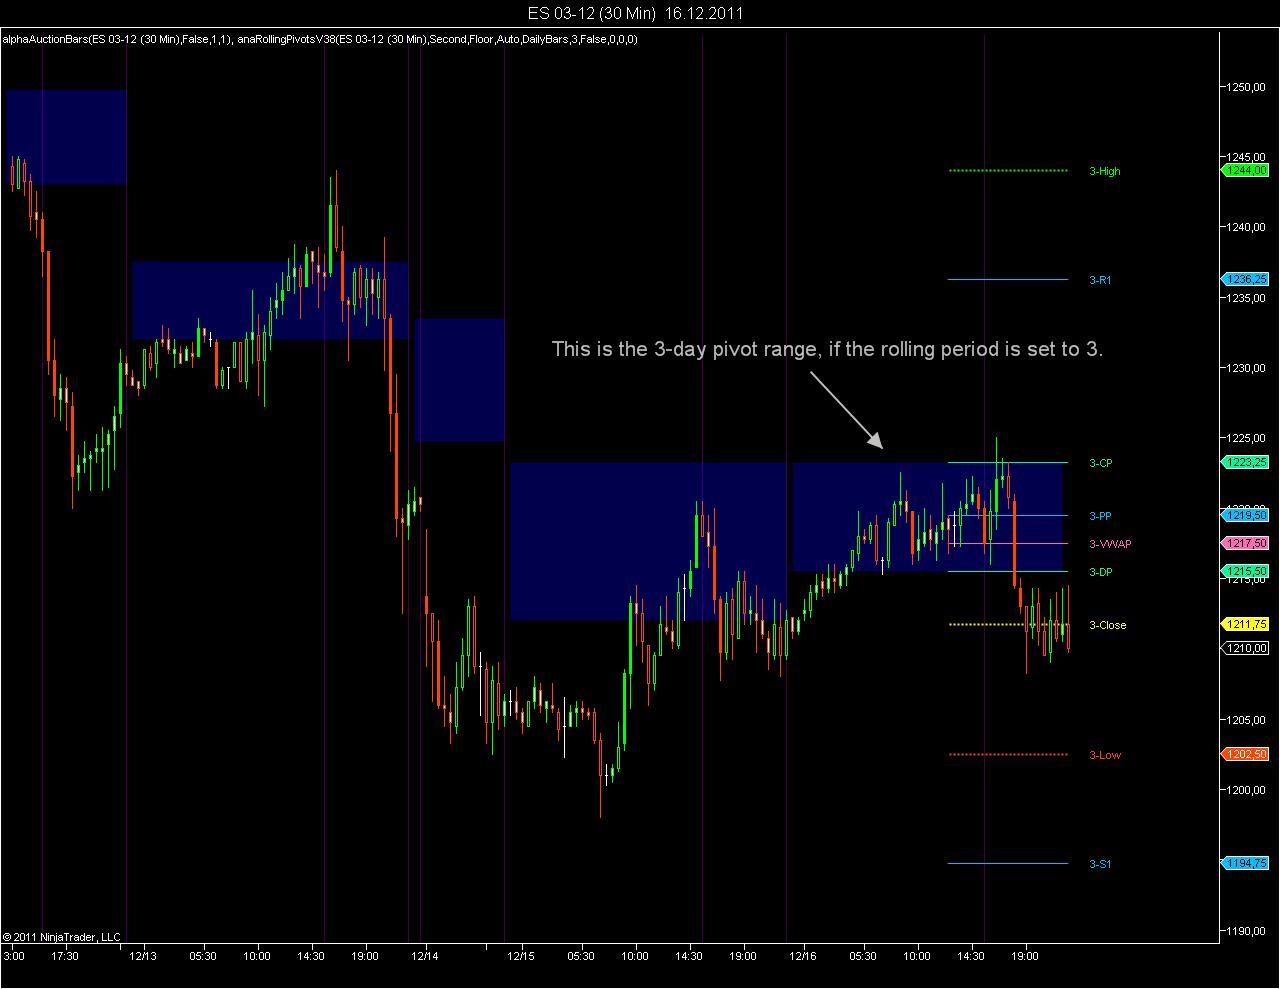
I have just updated the SessionPivots Rolling indicator to Version 38. The updated indicator will
- display pivot levels R5 and S5
- display the pivot range between the Central Pivot and the Directional Pivot
- use the CME/NYMEX double day sessions for 2012
Exported using NT Version 7.0.1000.26
Indicators will only run on NT 7.0.1000.5 or later.
This is an indicator that plots pivots for a n-day rolling period. It has similar features as the Daily Pivots indicator from the Session Pivots family. The …
I was wondering if you could explain how you use the session and volatility bands to identify potential breakouts as well as targets.
mfbreakout
BOSTON, MA
Legendary Market Wizard
Experience: Advanced
Platform: Tradestation, TOS
Trading: ES, CL, GC
Posts: 7,254 since Oct 2010
Thanks Given: 3,478
Thanks Received: 15,818
I had BAD trading day on Friday. All due to my desire to trade with size. I try to trade with size couple of times a month and mostly get SLAPPED. My system gets re balanced and i go back to more manageable position size.
Sooner or later , I will learn how to trade with big position.
forrestang
Chicago IL
Urban Samurai
Experience: None
Platform: Ninja, MT4, Matlab
Broker: CQG, AMP, MB, DTN
Trading: E/U, G/U
Posts: 1,336 since Jun 2010
Thanks Given: 354
Thanks Received: 1,049
Not to step on any toes..... so just some thoughts. And these are just some of MY likely ill-conceived ideas, no level of expertise is meant to be represented here
IMO they are good reversal areas. I.e. if price rallies from some low.... on the next day pierces the prior day HIGH... all the while violating the Average Range of some sort and reaches the top of the volatility bands, this is a possible area to take a trade looking for the reversal to capture the majority of the daily range that will occur if price moves down.
A lot more to it obviously, but that is the general idea in my head.
rw7117
Philadelphia
Posts: 17 since Dec 2011
Thanks Given: 2
Thanks Received: 2
When you say size how much you talking about.
Also, I know you trade ACD so I was wondering how close you follow it. I noticed for friday that you got long at 93.70 on a failed A down trade, With all due respect wouldn't that be kind of a risky ACD trade to trade with size.
Fat Tails
Berlin, Europe
Market Wizard
Experience: Advanced
Platform: NinjaTrader, MultiCharts
Broker: Interactive Brokers
Trading: Keyboard
Posts: 9,888 since Mar 2010
Thanks Given: 4,242
Thanks Received: 27,103
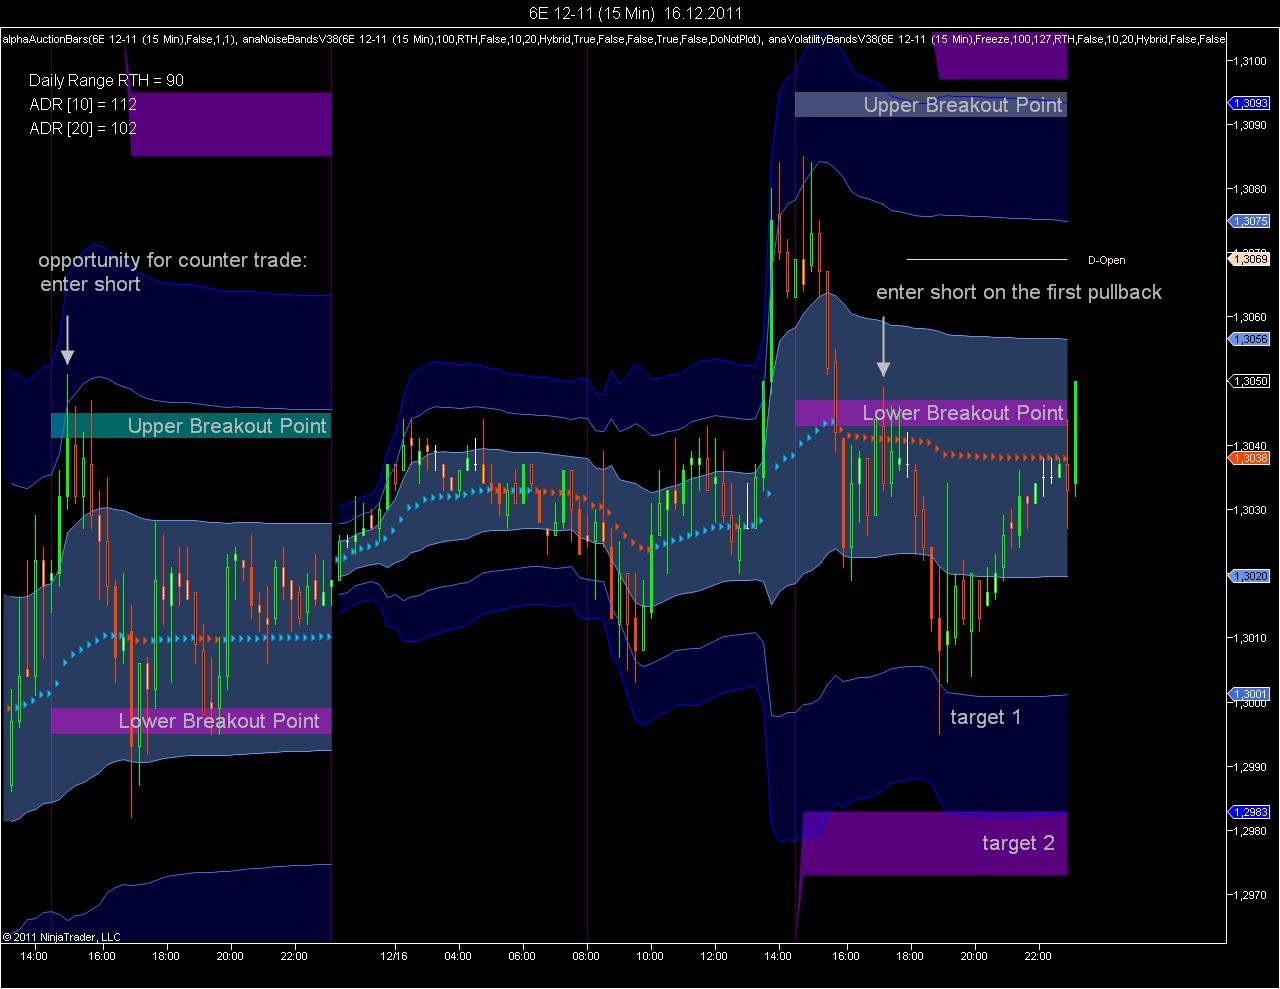
As an example, have a look at 6E 12-11 during the last two days.
SessionNoiseBands
These are levels, at which price action becomes significant, if a breakout occurs. All price action within the noise bands is just noise.
If we look at the price action on Thursday and Friday, we note that a breakout to the upside was not likely, as price had already moved too far away from the VWAP, as was indicated by breach of the 2SD bands. In that case the noise bands can be used for a counter trade.
On Friday a breakout occured from the lower breakout point. The breakout occurred too fast to enter short, but a reasonable short entry was possible on the first pullback.
Personally, I think that the noise bands are more reliable for trading breakout than the ACD levels promoted by Mark Fisher, therefore I do not use the ACD method. Maybe this is a question of taste. However, I do use the pivot range.
Session Volatility Bands
These are target bands derived from the average daily range. During the last days these targets were not reached, as volatility was already declining prior to the holiday season. The reduction of volatility is indicated by the SD bands of the VWAP. The daily range target is "out of reach", if it lies outside the 3SD band.
position size relative to ones account. For some 10 cars is starter and for some 40 cars is a starter and so on. My position size was not in sync with the type of trading day we had on Friday. Last Tuesday, Wednesday were type of days to have maximum position size.
Failed A downs and A ups are some of favorite set ups. I did not go long @93.70, I went long @93.90 with stop loss @ 93.49. I realized failed A down set up a bit late. 50 ticks stop loss is not good- even though trade worked out.
My mistake was to go long when 93.70 was broken on Volume. Counter weekly and daily trade. Trade was reactive and without solid plan.
Even though, i had 5 successful trades- 4 shorts and 1 long. One trade of going long with wrong size was too much. Only way to recover would have been to take other trades with same size. I reduced my size to get my senses together.
After 4,000 hours of screen time exclusively trading CL with ACD method ( live and sim) matching position size with trading day type continues to be my weakness. I feel it's just around the corner but looks like I am not ready yet. The only way to find is to trade.