Welcome to NexusFi: the best trading community on the planet, with over 150,000 members Sign Up Now for Free
Genuine reviews from real traders, not fake reviews from stealth vendors
Quality education from leading professional traders
We are a friendly, helpful, and positive community
We do not tolerate rude behavior, trolling, or vendors advertising in posts
We are here to help, just let us know what you need
You'll need to register in order to view the content of the threads and start contributing to our community. It's free for basic access, or support us by becoming an Elite Member -- see if you qualify for a discount below.
-- Big Mike, Site Administrator
(If you already have an account, login at the top of the page)
Sierra Chart Worksheet System For Trading/Alert Discussions
You can use the Text Display For Study study, but the value would need to be in row 3 of a Formula Column.
Formula Columns are subgraphs that the Text Display For Study study can reference.
To get the column H value displayed by the Text Display For Study study, you can use a formula like this in row 3 of a Formula Column:
=$H$1
This also works:
=IF(ROW()=3,$H$1,0)
Or this:
=IF(ROW()=3,$H$1,NOVALUE)
Ive created a spreadsheet system for trading for backtesting purposes and now am comfortable with the strategy but want to trade it manually, is there an easy way to change a spreadsheet system for trading into a spreadsheet system/alert? (Dont want to recreate the spreadsheet all over as its fairly complex)
Thanks
There is no direct way. Here are two indirect ways:
First, be sure you have saved the latest update of your Spreadsheet System for Trading study. Also, having a backup is always a good idea.
1. Different name, copy/paste method:
- Add the Spreadsheet System/Alert study, and give it a name in the Spreadsheet Name field. If you choose the same name as the Spreadsheet System for Trading study, go to #2 below.
- set the Number of Formula Columns to the same as used in the Spreadsheet System for Trading study. This is very important*.
- Highlight the entire sheet of the Spreadsheet System for Trading study, go to Spreadsheet >> Copy Formula.
- Highlight the entire sheet of the Spreadsheet System Alert study, go to Spreadsheet >> Paste.
- Highlight columns I and J of the Spreadsheet System Alert study and press delete.
- Go to the Spreadsheet System Alert study's settings and set draw styles, colors, and alerts.
2. Same name, overwrite method:
- Note the ID# of the Spreadsheet System for Trading study.
- Add the Spreadsheet System/Alert study, and Select the same name in the Spreadsheet Name field as the Spreadsheet System for Trading study.
- set the Number of Formula Columns to the same as used in the Spreadsheet System for Trading study. This is very important*.
- Remove the Spreadsheet System for Trading study, verifying it with its noted ID#.
- Highlight columns I and J of the Spreadsheet System Alert study and press delete.
- Go to the Spreadsheet System Alert study's settings and set draw styles, colors, and alerts.
*The Number of Formula Columns in the Spreadsheet System/Alert study must be >= those used by your Spreadsheet System for Trading study so that formulas will not be overwritten by study output values.
Curious if there is a spreadsheet log or debugging device that shows the timeline of what triggered a buy/sell/unwind signal within q spreadsheet system for trading?
Thanks
If there is more than one condition for a signal, you will only be able to delineate which one by manually examining the event.
IOW, if it's TRUE, it's TRUE.
I've recently been getting into automated trading with Sierra and I keep seeing your helpful posts when I'm searching for info, thankyou!
I'm finding it quite challenging to learn via Sierra documentation. I've watched some video tutorials which were very helpful as I learn 10x faster by seeing examples.
I've created a spreadsheet strategy, I'm happy with it and now looking to have it use limit orders instead of market orders. I've read the documentation and searched for the info but I'm not finding what I need.
Here is an example I created for demonstration purposes.
Buy entry: =AND([email protected]@3>10*J21,ID0.SG4@3>ID0.SG1@4)
// if close minus open is greater then 10 ticks and bar closes up its a valid signal
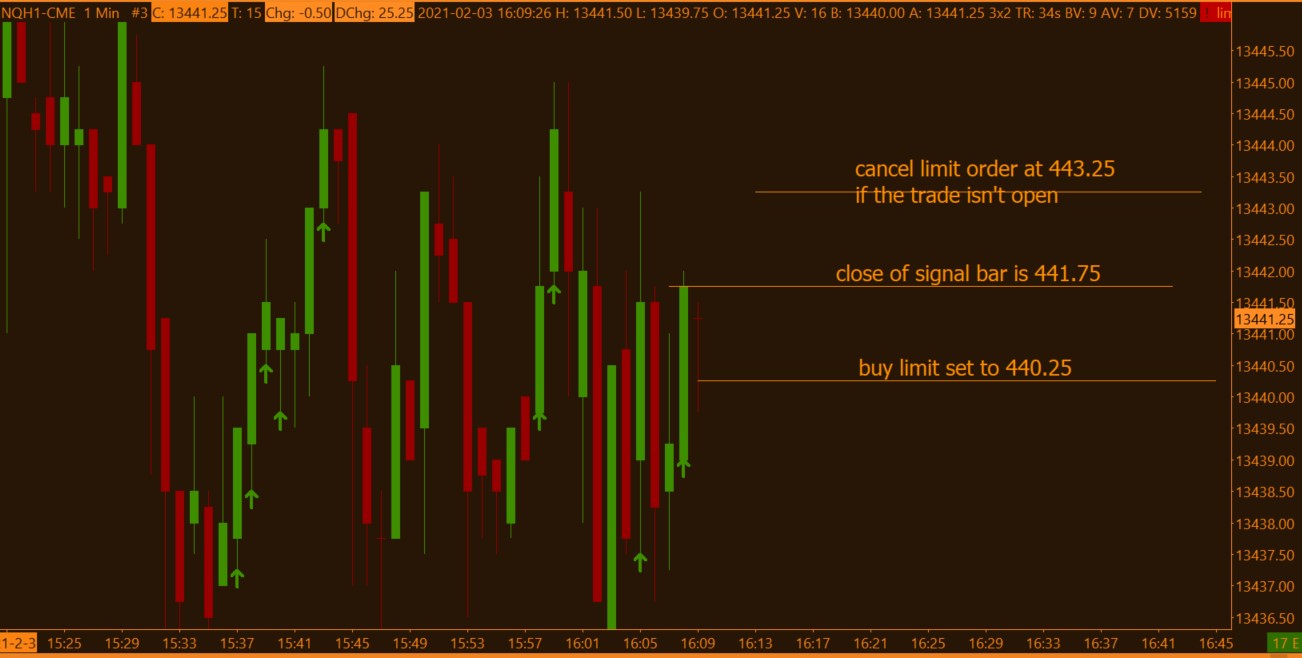
Please will you show me how to modify this example spreadsheet so: if buy entry is true, then it sets a buy limit order 6 ticks below close of buy signal bar and if price goes 6 ticks beyond signal bar it cancels the limit. This would be a huge help. (my oco orders are managed using trade window)
First, you must use an absolute reference to J21 in formulas in Formula Columns:
=AND([email protected]@3>10*$J$21,ID0.SG4@3>ID0.SG1@3)
Also, you could shorten it by using alphanumeric cell references:
=AND(E3-B3>10*$J$21,E3>B3)
However, it is recommended to use the ID#.SG# references of study outputs in columns AA and above.
To place a Limit order:
- The signal is in K3/M3.
Use the corrected formula.
- The limit price is in J22/J24.
J22: =C4-J21*6
J24: =D4+J21*6
Row 4 is referenced because it is the close of bar value.
- The order type is in J71/J73
Set them to L
If you get slippage, you may not want to use J48, in which case you'll need to use a Formula Column to create a persistent price of the signal bar's close, then reference it in J27 instead of J48.
Use formulas like these examples:
For longs, in P3:
=IF(K3,E3,P4)
For shorts, in Q3:
=IF(M3,E3,Q4)
You will probably need to experiment with all of these formulas to get what you want.
Welcome to the club. The results are worth the effort, but learning curve is steep. I've only been there since Dec. Glad to see SC community picking up here.