Welcome to NexusFi: the best trading community on the planet, with over 150,000 members Sign Up Now for Free
Genuine reviews from real traders, not fake reviews from stealth vendors
Quality education from leading professional traders
We are a friendly, helpful, and positive community
We do not tolerate rude behavior, trolling, or vendors advertising in posts
We are here to help, just let us know what you need
You'll need to register in order to view the content of the threads and start contributing to our community. It's free for basic access, or support us by becoming an Elite Member -- see if you qualify for a discount below.
-- Big Mike, Site Administrator
(If you already have an account, login at the top of the page)
Tuesday 24 January 2012
We took out the lows in early morning, therefore there is really no reason for it to go down. My estimate for the high was 1310.25 and we haven't quite made that.
So Why down?
The 30 min chart may have had an uptrendline break (see dotted light blue line). We went below it and are now back up into the upchannel. The 50% is at 1310 (showing 1309.98 red line). If we bounce off this (we have had 1309.75 -so far this moringing), then we could go down towards 1298.75 to 1297.25 area.
We really have to break 1306.50 so calling down now it a bit too early. The SMA35 on the 5 is still up -so the trend of the day (TOD) is still up. It could turn into a "long T-top" day, so a short trade here would fizzle.
While I have been typing this ES has moved up slightly and seems to be entering the mid-day doldrums.
ES 3 Min chart
..........
peace, love and joy to you
.........
Can you help answer these questions from other members on NexusFi?
I have updated to remind myself of 2 learning lessons:
If 80% of the expected range is in the OTW then don't expect an intraday change of trend (ICOT).
Don't forget you SMA35 guideline.
Neither of these are new lessons. However I seem to be in a loop and keep repeating my learning.
I hope once this MF Global claim form is behind me I can mentally move forward. I have been pretty good about my resolution ofr taking a walk a day. However, I'm back to the old "not-enough-time-in-the-day" situation. Now, however I just am not going to stress about it. If it doesn't get done it wasn't mean to be.
Keep smiling - its the only life you've got
-unti the next incarnation LOL!
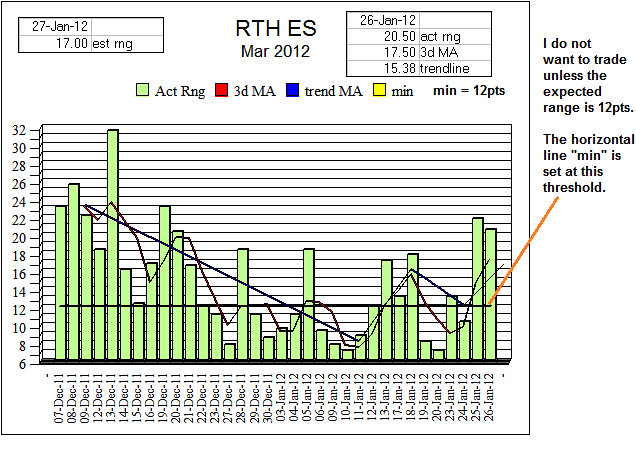
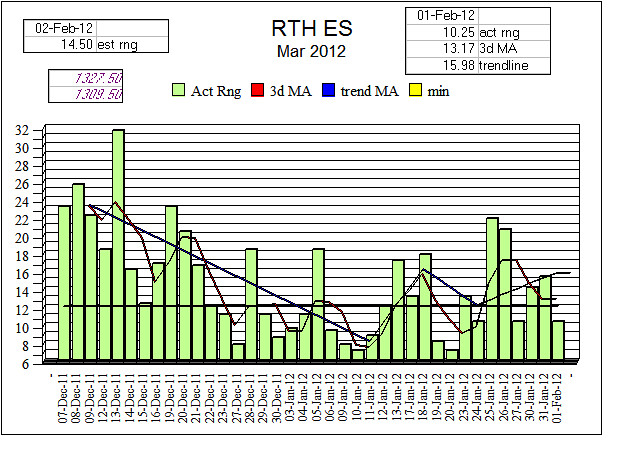
One of the things I try to estimate is the next day's range.
Most of the formula are in my XP based system which I am working on restoring. (I am currently working on a Windows 7 laptop - my back up system).
The estimate shown is very crude. It is simply fitting a line to the data. After the range stopped reducing (here the 24 Jan) I changed the fitted line to +1.5 pts/day. The 3d MA line (17.5) is currently above the fitted line (17).
I am working on some ideas for prediction of range expansion and range contraction though none are shown here.
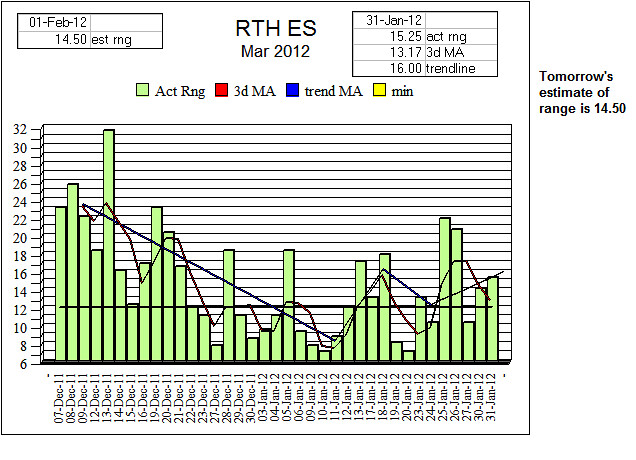
Monday 31 Jan 2012
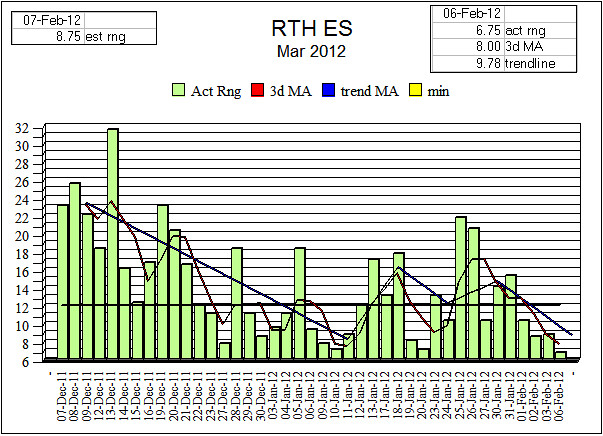
Here's is my estimate for the rnge for tomorrow.
Today's accomplishments include getting up within 30 min of the schedule and estimating the low end=FE to the tick.
Accomplishments for today:
1. Picked FE=HE which was correct HE=1317.50 @ 8:39. This = the o/n high so there was no stop-running of the o/n high. This makes sense (after the fact as the o/n high took out yesterday's RTH high by 7.50)
Learning Lesson: Add stop run to RTH high and subtract from RTH low to give you levels to check against the following morning to see if the stops were run in the o/n session.
To do: keep a sheet with days across the top and min max levels. Do standard ext/retracements to the ETH min max and write above the day's of the week and below the bottom. Keep "weekly" high/low (running 5 day max/min) and 3day). Graph as simple boxes that give a clear view of 3d and 5 day stop/runs.
2. Got up within 1/2 hour of alarm.
3. Got copy of MF claim form emailed as backup.
4. Mechanical estimate of H/l was very close
High:1317.51317.00=estLow:1302.251303.00=est
Accomplichments:
1. Dir 30 est was slightly upwards +> FE=HE which was correct.
2. Called 1323.50 for high before 10am correct.
3. Taylor "Buy Caret" day - correct
High:1327.00 vs 1328.25=est
Low:1316.75 vs 1313.00=est
Range est was too wide with est of 14.25 versus 10.25. In big moves in o/n - last night was 16.50 - very wide- and the o/h high of 1320.25 pushed through yesterday's high of 1316.25 we can expect a narrow range in a high area especialy with close to open of +10.25. For such conditins the on factor is 0.625
As I had gotten up early Mon-Thurs I was very tired on Friday and slept in.
I have keep my resoultion of a daily walk and only missed one day since January.
I have also resolved to get the sleep I need and so if a wave of tiredness comes over me - I sleep.
The markets edged higher during the week and exploded upwards on Friday at 7:30am rocketing 1323 to 1337 in 8 minutes. that is +14pts.
In the prior 5 day the lowest high of the week was 1309.50 (Tues the 31 of Jan) and the highest high was 1327 (Thurs 1 Feb). So in 5 days the high had only changed 17.5 pts
Friday's high of 1342 is only 25.25pts from the RTH 2 May 2011 of high of 1367.25 and 31.5pts from the ETH high of 1373.50