thx, K
Posted some examples on how to use in reading charts and action
https://nexusfi.com/elite-circle/27433-k_bettervolume-tos-new-version-downloads.html
Here's an interesting view of volume that I've been watching for a while. Added to the K_BetterVolume indicator I posted here a while back.
Instead of watching the classic volume bar by bar plot, I started watching the average buy vs sell for a period, which I found much more insightful. A stronger/more sustained price move is usually associated with a net volume avg forming in the same direction, also moves with no strong volume supporting them will possibly be short-lived- this simple way to view volume is especially useful when there's no easy way to track volume at bid/ask level, or if you don't want to go that deep...
Changes in this version:
- A simple way to track Buy vs Sell volume for a given length of bars, "Directional Volume, or Volume Pressure or VXNet", which is the net of ratio of buy vs sell avg volume (WMA) to the overall volume average. inspired by a similar concept in one of Elder's study
- added a volume buzz label calculation (the closest I could get to a VolBuzz calc in ToS, impossible to do in custom WatchLists or scans). By Changing the chart aggregation, I can check the VolBuzz (basically current bar's volume vs longer average volume of same time interval)
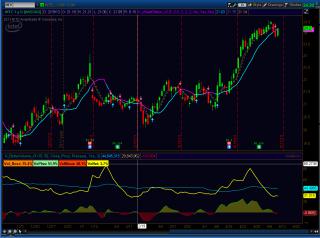
- VXNet can be displayed on top of the "classic" volume plot, or separately .. changing plot settings enables to view it as a histogram, or just a simple green/red cloud.. see screencap for examples of how this study can be set
- VXNet is zero-lag smoothed, however keep smoothing as small as possible (3 to 5) not to lose traction to actual volume trend change
- informative labels, can be turned on or off - Dynamic coloring
Changes in V3 - May, 2013
--------------
Changed the Algo that calculates Sell / Buy volume to the same one developed by Barry Taylor at EminiWatch for TradeStation, and mentioned in our VSA for thinkorswim thread here https://nexusfi.com/thinkorswim-programming/3477-vsa-thinkorswim.html
this algo does test well and provides a better signal (sometimes up to 3 bar improvment) than taking the whole volume bar as a buy or sell volume based on the close vs open technique in prior version..
The Dynamics coloring of the info labels still there, provides visual clue for major volume spikes that deserve attention
code is commented.. TOS Study setup "baloon mini-guide" also included.
RedK
Category The Elite Circle
|
|
|


 an NT7 version