This is for VIP Users Only. So please don't distribute or post elsewhere.
The inspiration came from websouth's template, which I started a discussion on here:
websouth's shared Price Action templates
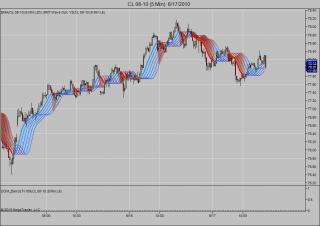
The indicator works a little different than websouth's implementation, because he was using the displacement chart feature which puts lines behind (historical) price. Within the indicator, I just painted the line using historical data, but it still plots real-time.
At any rate, it is a very interesting indicator. Sometimes it is a thing of beauty, others the visual aesthetics are not appealing but that usually means chop. If the indicator looks like shit then the price action is probably shit, too. 
All colors are fully configurable, as is the shading, and opacity. You can also control the historical period rate.
Attached are a few screens plus the indicator. It's the top panel stuff.
I look forward to your input
Mike
Optimized by Zondor for NT7: 6/17/2010
COMPATIBILITY:
NinjaTrader 6.5: YES
NinjaTrader 7.0: YES
Category The Elite Circle
|
|
|


