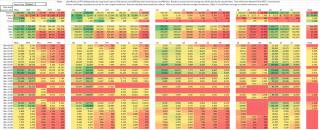
An indicator JFTrueRange calculated the true range for each bar and generated a report that was then copied into excel. It average the true range for all bars on a given day of the week and time of day. i.e. for 15 minute bars, it average all the bars at 6:00 for monday, at 6:15 for monday, etc for all times and days of week. For daily bars, it averaged 1000 days. For minute bars, it averaged 400 days. The report includes statistics an each futures contract for daily, 240, 60, 15 & 5 minute bars. For each bar it used the TickSize & PointValue to determine the price range, tick range & point range per bar. Daily bars ended at different times. So that is an interesting artifact you will see in the data.
In the summary report volume is higher in the high timeframe reports (daily, 240 min) than in the lower timeframe reports (15min & 5min). This is because I totaled the volume at each timeframe and this included the odd times that bars were reported. The higher daily volume at 15:00 is approximately the same as the lower timeframe bar totals.
Finally, the true range reported in points, ticks and dollars is higher at low timeframes as expected. This is because it takes into account all the smaller price fluctuations. Some of these fluctuations are inside the higher timeframe bars and are thus washed out.
Note: The timeframe used in the reports was Mountain Time (MT). Sorry, that is my timezone. So do the mental adjustment or modify the times to meet your needs.
I hope you find this report interesting and useful.
Category The Elite Circle
|
|
|
